


A Concerning Stock Market Development
Despite widespread optimism, the U.S. stock market failed to deliver a strong Santa Claus rally and is now undergoing a technical breakdown.

Since President-elect Donald Trump’s victory in the U.S. presidential election in November, economic optimism has surged across the country. The stock market climbed in the weeks that followed, though not to the extent one might expect given the heightened optimism. Wall Street had high hopes for a Santa Claus rally, but those hopes were dashed just a week before Christmas on December 18th.
On that day, the Federal Reserve cut its benchmark lending rate by 25 basis points as expected but signaled a slower pace of future rate reductions, which weighed heavily on investor sentiment. As a result, the S&P 500 dropped 3.05%, while the Nasdaq 100 declined 3.64%. As the new year begins, signs are emerging of a technical breakdown in stocks, warranting close attention.
Following an initial surge in response to the U.S. presidential election, the S&P 500 gradually climbed to new all-time highs. However, it peaked and declined sharply on December 18th. For the past few weeks, the S&P 500 has been struggling to remain above the 5,900 to 6,000 support zone. On Friday, it started to breach this zone to the downside. I’ll be watching for additional confirmation, such as a continued breakdown on strong volume. If that occurs, it would signal a higher probability of further downside.

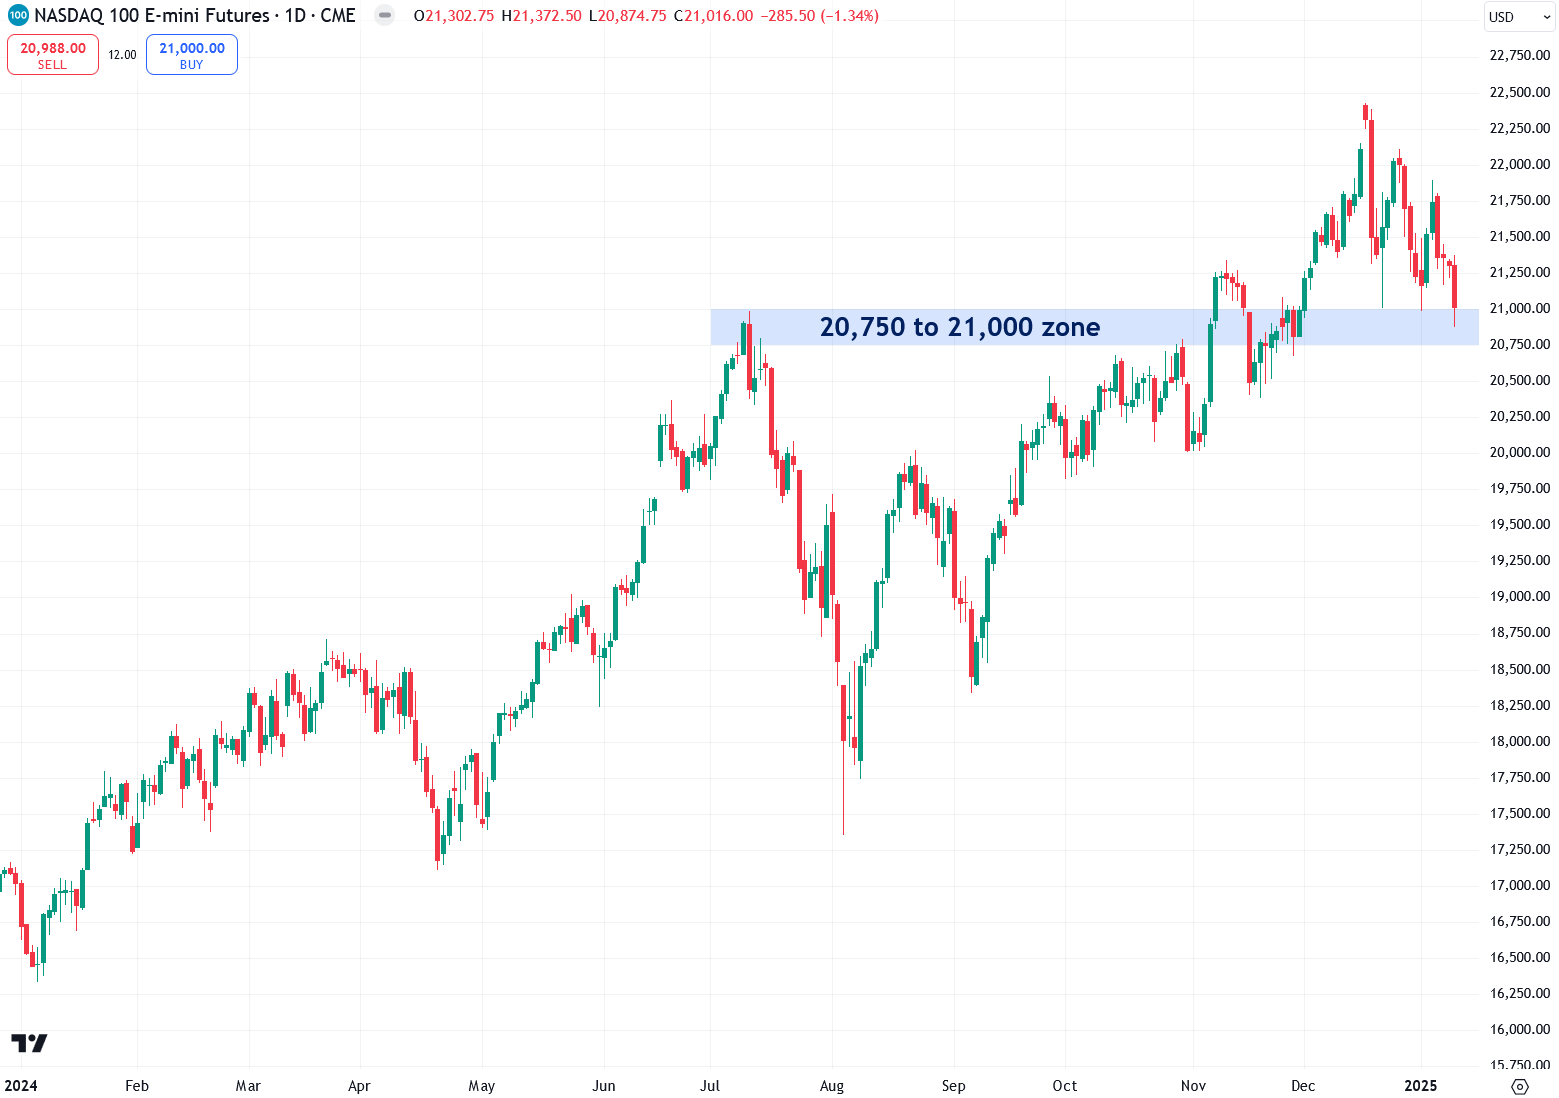
The Nasdaq 100, bolstered by high-flying tech giants known as the Magnificent 7 (Alphabet, Amazon, Apple, Meta, Microsoft, NVIDIA, and Tesla), outperformed the S&P 500 following the election. However, it has also experienced a sharp sell-off since December 18th. Currently, the index is hovering just above the 20,750 to 21,000 support zone. A bounce off this level would be an encouraging signal, but a decisive close below it on strong volume would likely indicate further downside ahead.
The Magnificent 7 exchange-traded fund (symbol: MAGS) has shown strong performance over the past two months but has recently pulled back. The $50 level serves as a critical support to monitor. Holding above this level would be a positive sign, but a decisive close below it would signal further weakness for both the Magnificent 7 stocks and the broader U.S. stock market.

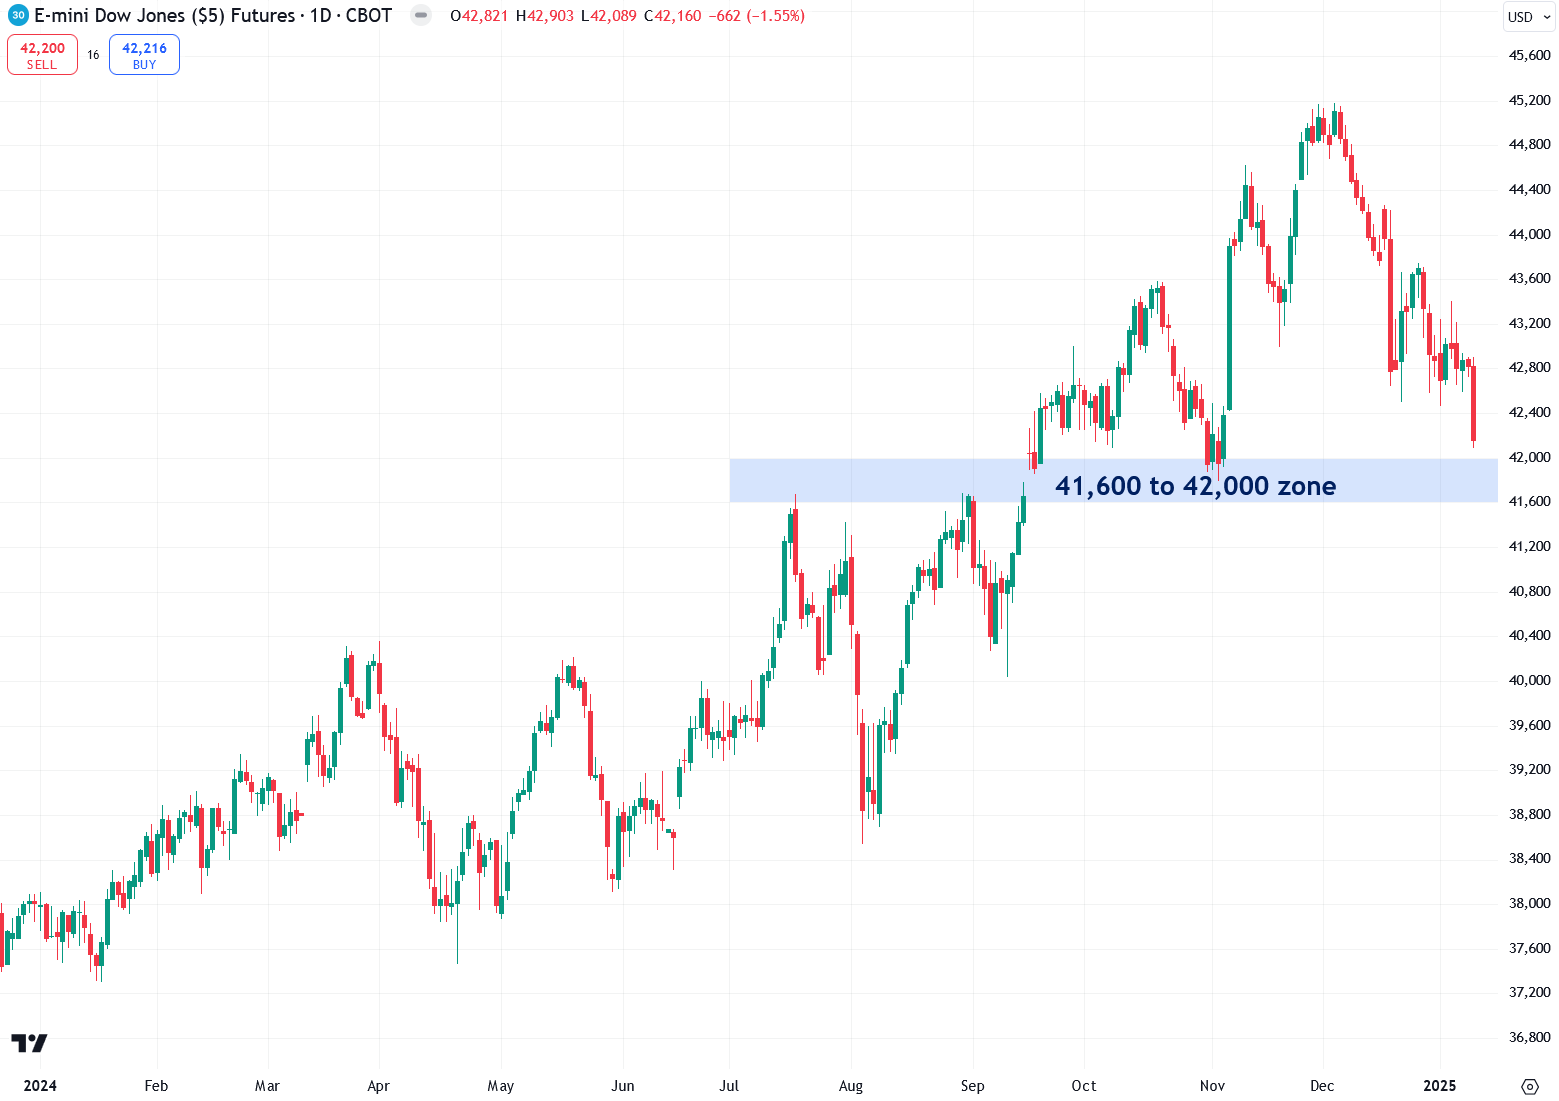
Following a brief rally in November, the Dow Jones Industrial Average swiftly reversed course, erasing all its post-election gains. The 41,600 to 42,000 range now represents a key support zone to watch. A rebound from this level would be a positive signal, but a decisive close below it would indicate further weakness ahead.
The small-cap Russell 2000 index recently staged a strong breakout above its 2,300–2,325 resistance zone in November but has since fallen back below that level, signaling weakness. The next critical support lies in the 2,175–2,200 range. A bounce off this level would be an encouraging sign, while a decisive close below it would point to further downside ahead.

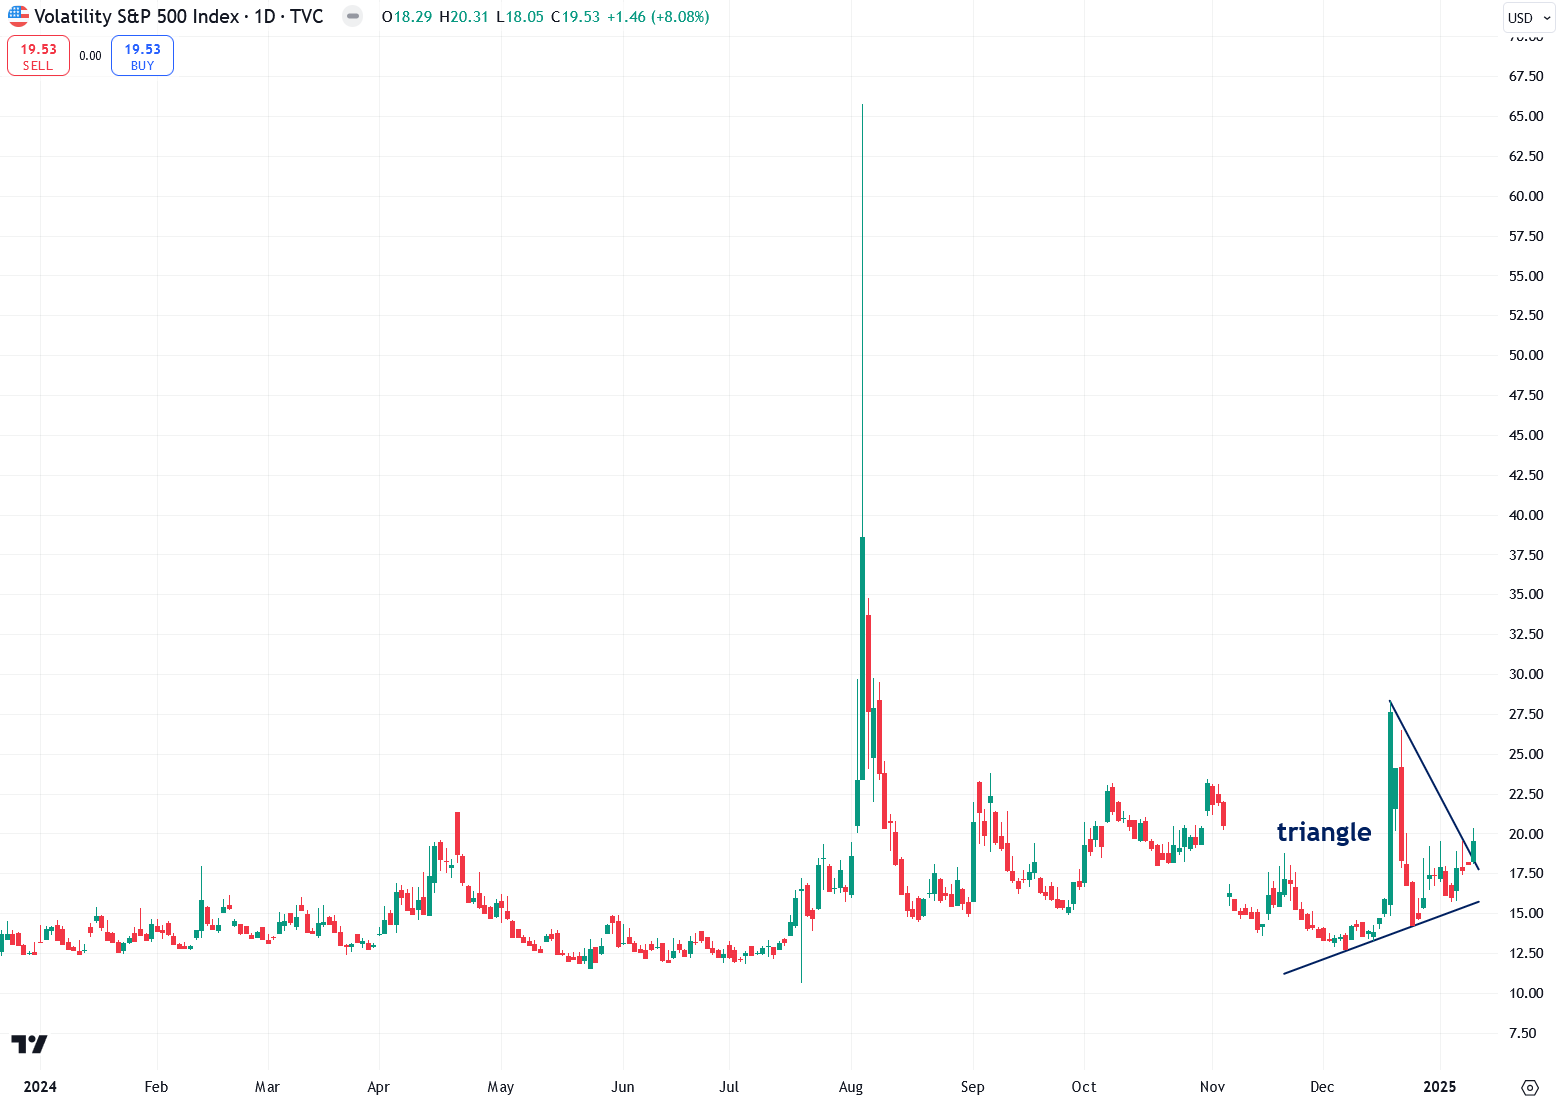
The CBOE Volatility Index or VIX, which is considered to be the stock market's "fear gauge," has remained at unusually low levels for much of the past year due to investor optimism. However, it has recently shown signs of perking up, including a nascent breakout from a triangle pattern that developed over the past month. If this breakout gains momentum, it would signal further weakness in the stock market.
Bitcoin is a key indicator for gauging investor appetite for risk assets, including stocks. As I recently explained, Bitcoin is highly correlated with the tech-heavy Nasdaq 100 index, often mirroring its movements. While Bitcoin surged following the election, it has since struggled to maintain momentum, disappointing investors who anticipated an even stronger rally. Currently, Bitcoin is holding above the critical 90,000 to 92,500 support zone. A decisive close below this level would be bearish for Bitcoin and could also signal further weakness in the stock market.

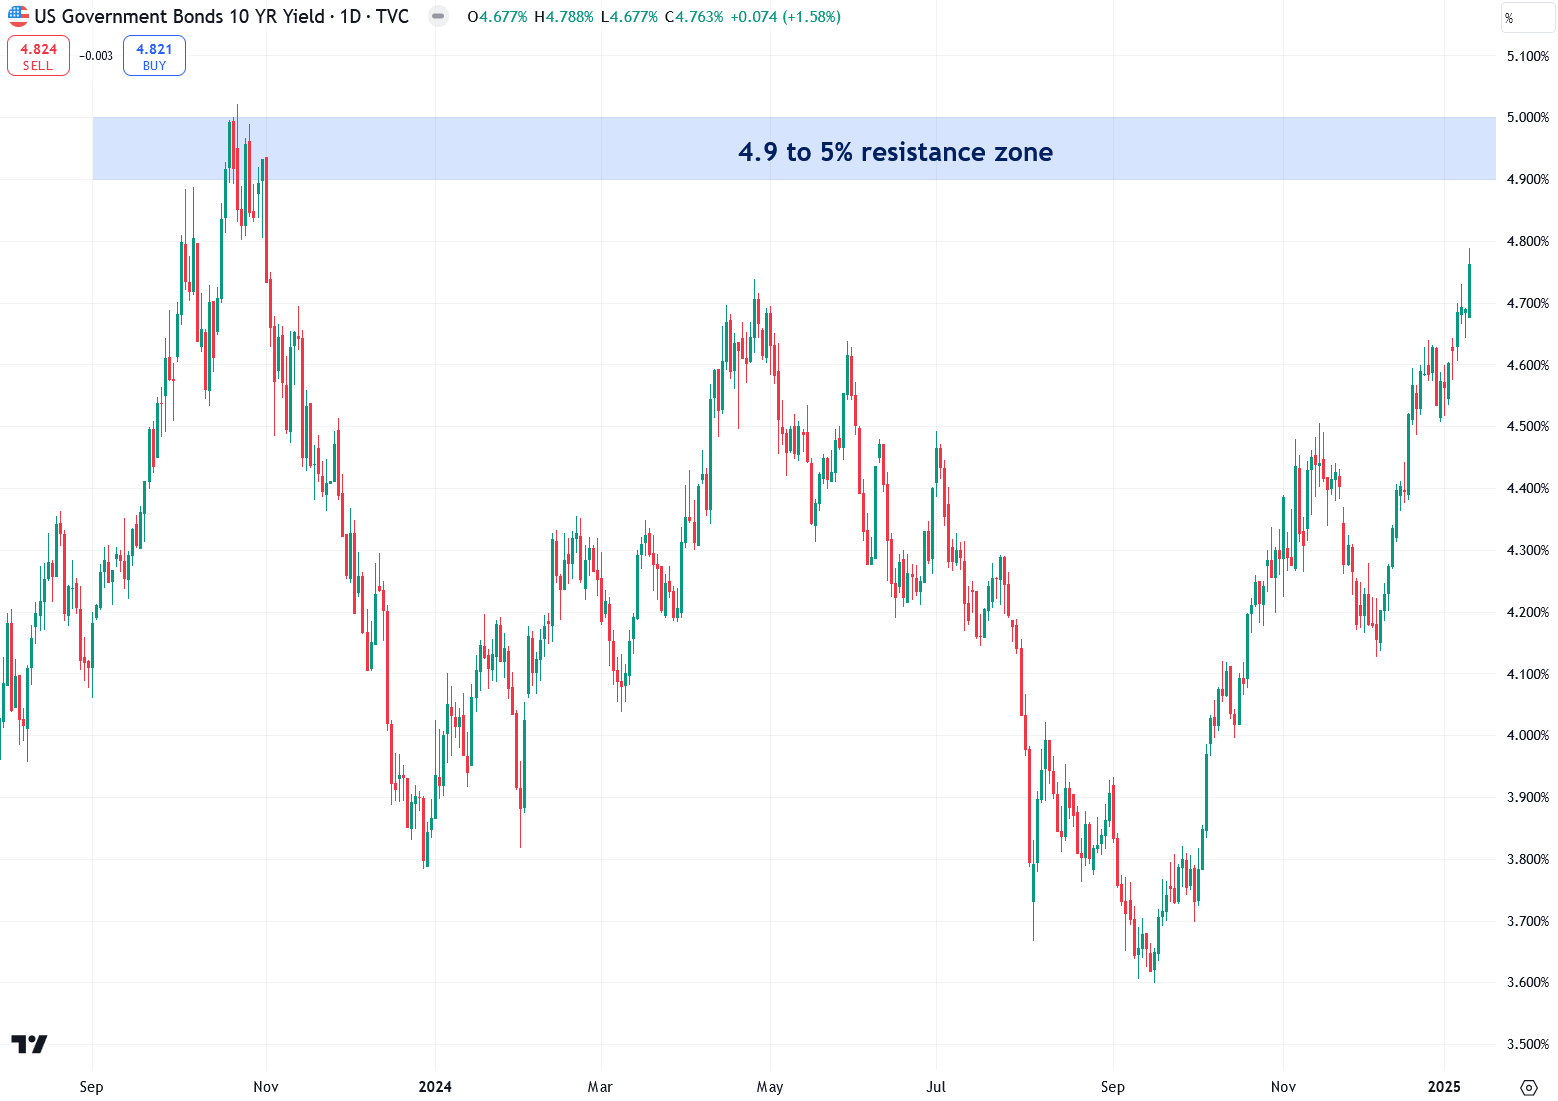
One reason for the recent weakness in the U.S. stock market is the surge in bond yields, driven by expectations that the Trump Administration's economic policies—particularly tariffs—will fuel inflation. The benchmark U.S. Treasury 10-year yield has climbed sharply from 3.6% in September to nearly 4.8%. Overhead, there is a key resistance zone between 4.9% and 5%, which is likely to act as a magnet for the yield. The critical question is whether it will bump its head against this zone and retreat or close decisively above it. A breakout above this level would likely signal further gains in yields, which would spell trouble for stocks.
A widely monitored measure of inflation expectations, the 5-year breakeven inflation rate, reveals a significant surge since early September. This increase is corroborated by several other indicators, including Truflation’s real-time US Inflation Index, the University of Michigan's 1-year inflation expectations data, and the performance of the ProShares Inflation Expectations ETF.
The stock market is particularly vulnerable right now, largely because investor sentiment is at its most bullish in decades. This excessive optimism implies that much of the potential growth is already priced in, leaving the market highly sensitive to even minor disappointments, as evidenced by the sharp decline on December 18th.
According to the latest Conference Board survey, an astonishing 52.9% of Americans—an even higher percentage than during the dot-com bubble—believe stock prices will rise over the next twelve months. From a contrarian perspective, this is deeply concerning. Extreme bullishness among retail investors is a hallmark of a market bubble and typically precedes a major peak, followed by a sharp downturn or bear market.

Another key indicator, the Euphoriameter, confirms that investor bullishness has reached unprecedented levels, surpassing even the exuberance seen during the dot-com bubble, which ended in a devastating bear market:

Additional proof of extreme U.S. investor optimism is their record-high allocation to stocks, which has now reached 43.38%. This reckless "all-in" positioning comes at a time of record-high stock valuations and a rapidly aging investor population, making them particularly vulnerable to the risk of a bear market—a risk that younger investors are better equipped to endure. Unfortunately, this overexposure means that significant financial pain lies ahead for these investors.

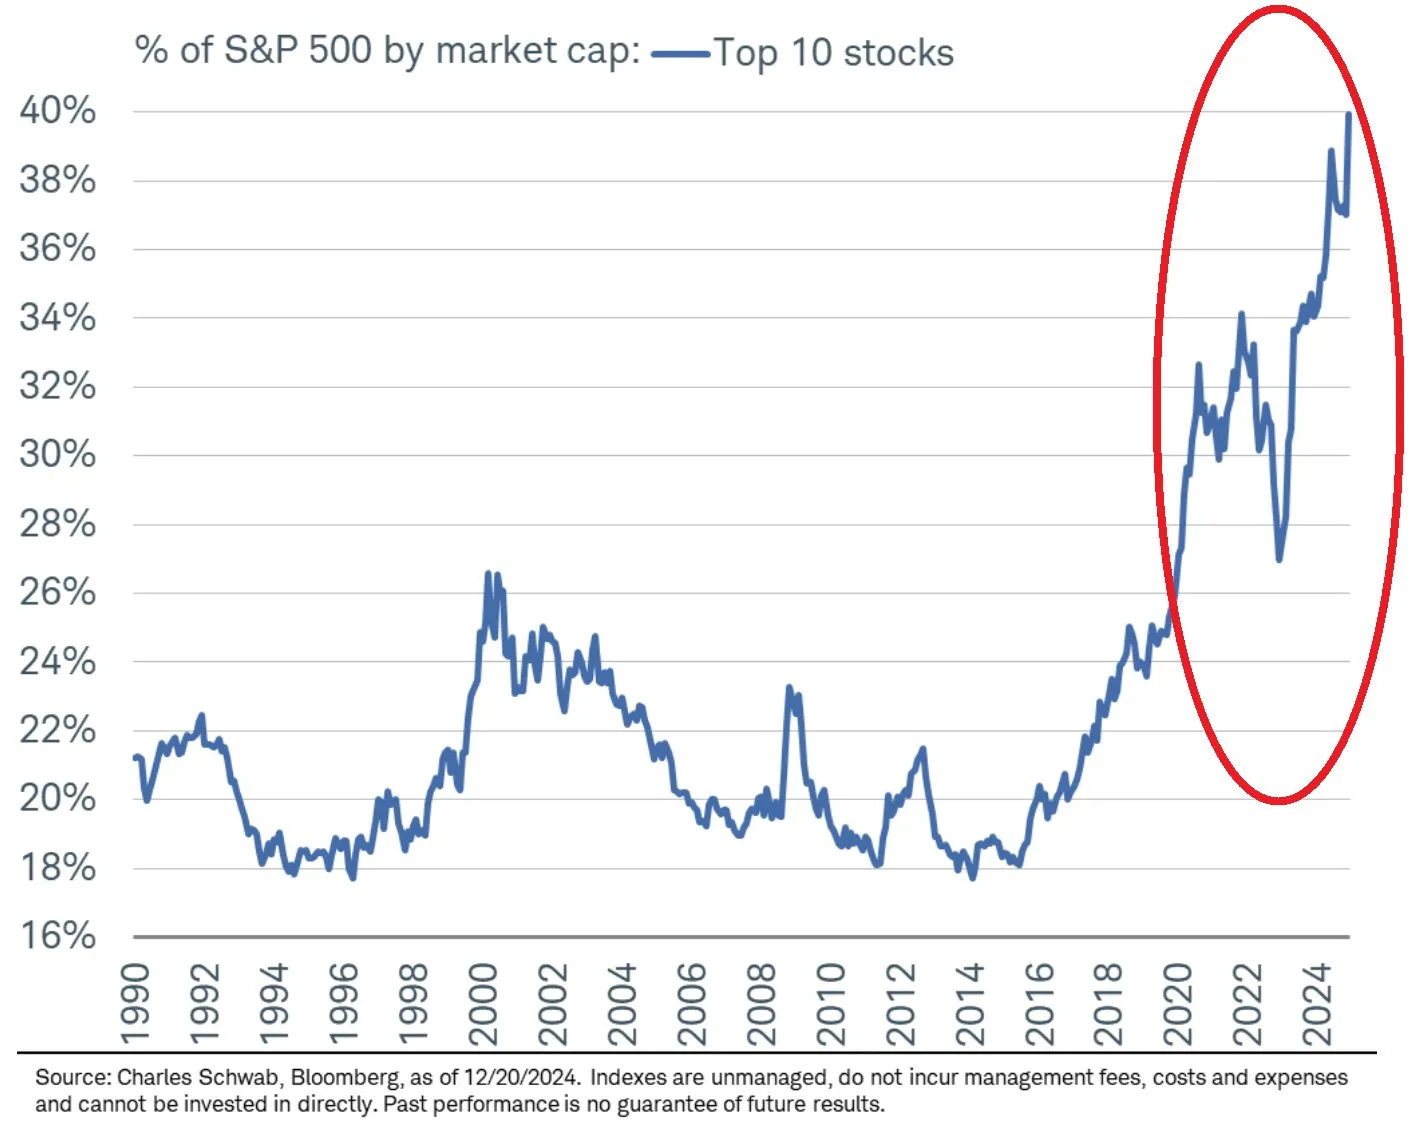
The current stock market bubble is marked by an extreme concentration of market capitalization in the top 10 stocks, largely driven by the high-flying "Magnificent Seven" mentioned earlier. This narrow leadership indicates that the market boom is not broad-based, making it particularly vulnerable to a downturn when these dominant stocks eventually falter. A similar phenomenon occurred with the "Nifty Fifty" stocks of the 1960s and 1970s, which enjoyed immense popularity before sinking in the 1970s, leading to a prolonged period of stagnation for the broader market until the early 1980s.
A highly revealing measure of whether the stock market is in bubble territory is the total U.S. stock market capitalization-to-GDP ratio, which compares the market's total value to the underlying economy. This metric is often referred to as the "Buffett Indicator," as Warren Buffett has famously called it "the best single measure of where valuations stand at any given moment."

When the stock market grows faster than the economy, the stock market capitalization-to-GDP ratio rises—leaving the market vulnerable to a correction. Currently, this indicator stands at a staggering 206, which is 142% above its long-term average of 85, dating back to 1971. This is clear and undeniable evidence that the U.S. stock market is drastically overvalued—surpassing even the excesses of the late-1990s dot-com bubble, which ended in disaster. History shows that valuations inevitably revert to the mean over time, putting the market at serious risk of a sharp and violent downturn.
A perfect storm is forming, driven by extreme investor bullish sentiment, record-high allocations to stocks, unprecedented market valuations, and now—adding fuel to the fire—a high likelihood of an impending recession, as I recently explained. One notable recession indicator, the New York Fed Recession Probability Model, as plotted in the chart below, warns that the economy is likely already in a recession. Historically, recessions have been notorious for bursting stock market bubbles, often triggering severe bear markets.

Much of today's investor optimism stems from Trump's election victory and the high hopes for his ability to revitalize the economy and reduce the deficit. While I genuinely hope for his success, I remain skeptical for several reasons. Chief among them is the sheer magnitude of the challenge—he cannot simply erase centuries of accumulated public debt, nor can he address the vast private debts that lie beyond his jurisdiction.
Unsurprisingly, despite the initial hype, expectations for what Elon Musk's Department of Government Efficiency (DOGE) can achieve are already being tempered. Musk initially claimed he could recommend at least $2 trillion in federal budget cuts but has since revised that estimate to perhaps half as much. The challenge lies in the fact that budget deficits play a significant role in propping up the economy and funding government salaries. Drastic cuts to the deficit would plunge the country into an economic slump—the exact opposite of Trump's goal of achieving quick economic wins.

The inevitable bursting of the massive U.S. stock market bubble will undoubtedly cause significant pain for most investors and the broader economy. However, it will prove to be a highly bullish catalyst for gold. Stocks and gold compete for capital, and when the stock market sinks into a bear market, it typically triggers a capital rotation. This shift is likely to result in massive outflows from overinflated equities into undervalued gold, propelling gold prices toward $10,000 an ounce and eventually even higher. This surge in gold will also provide a tailwind for silver, driving its value higher alongside it.
While the concept of capital rotation is known among seasoned precious metals analysts and investors, I want to credit analysts Kevin Wadsworth and Patrick Karim for their in-depth discussions and insights, which helped illuminate key nuances of this phenomenon. In particular, they drew my attention to the chart below—a log scale chart of the Dow-to-gold ratio—that provides valuable perspective on this dynamic.

Each time the Dow-to-gold ratio breaks a major trendline, it signals the start of a new secular trend. A break below an uptrend line signals that gold is poised to outperform stocks, while a break above a downtrend line indicates that stocks will outperform gold. Notably, the major secular bull markets in both gold and stocks over at least the past century have been preceded by such trendline breaks.
What’s particularly intriguing is that the Dow-to-gold ratio broke below its uptrend line in the spring of 2024. This indicates that a capital rotation from stocks to gold is already underway, and this shift will accelerate when the current stock market bubble inevitably bursts.
To wrap things up, the purpose of this article is to highlight the downside risks that stocks currently face. If the market manages to bounce back, reverse its recent bearish trajectory, and hold above key support levels, the risk of a sell-off will be mitigated—at least for now. However, if stocks break below those critical support zones I showed, the likelihood of a more substantial sell-off increases significantly. When it comes to short-term market movements, I don’t attempt to predict; I take a reactive approach instead. I let the market dictate its direction, observing whether it shows strength or weakness, and I adjust accordingly rather than trying to second-guess its next move.
Excellent exposition, thank you. When stocks break down, historically gold is also badly hit but it is the first to recover, but with central banks propping gold up and an increasingly worrisome geopolitical outlook gold may be less hard hit than in the past. It will be a very interesting year...
Excellent article! Not complicated to understand, doesn’t misguide or confuse my criteria at the time to take a decision.
Thank you and please keep commenting your thoughts.