


A Deep Dive into the Long-Term Bullish Case for Gold
This is the first installment in a powerful, must-read series where I lay out why I’m extremely bullish on gold and silver mining stocks.

I'm excited to publish this report today—it marks the beginning of a comprehensive multi-part series on the bullish case for gold and silver mining stocks. To be honest, I’m also a bit daunted. This is an incredibly broad and deep topic—one that could easily justify its own book. But my goal is to break it down into a clear, digestible series of sub-reports. I’ll start with the most logical foundation: the comprehensive long-term bullish case for gold. The rest of my mining stock thesis will build upon that base. I hope you enjoy this series and find it as insightful and valuable as I intend it to be. Let’s dive in!
Introduction
After more than a decade of stagnation from 2012 to early 2024, gold finally sprang back to life last spring—decisively breaking above the key $2,000 per ounce psychological level and signaling the start of a powerful new bull market. I strongly suspected that something big was brewing in gold that very day—just hours before the surge began.
Sure enough, gold’s breakout in early 2024 also completed a massive 12-year cup-and-handle pattern—a textbook bullish setup. This formation not only foreshadowed gold’s $1,300-per-ounce surge over the past year, but it also signals that the bull market likely has much further to run—even from current levels with gold already above $3,300 an ounce. If history is any guide, major gold breakouts like this don’t fade quickly—they tend to kick off bull markets that last a decade or more.

The Monetary and Fiscal Case for Gold
There are numerous factors that influence the price of gold, but the most important one—the core reason to remain long-term bullish—is that the world’s major currencies, from the U.S. dollar to the euro to the Japanese yen, are backed by nothing. They’re essentially just paper, easily created in unlimited quantities by governments and central banks to serve their own agendas.
And serving their own agendas is what they do best—whether it’s funding deficits, the welfare state, bailouts, or pet projects—and in the end, it’s everyday workers and savers who bear the cost, as their hard-earned savings steadily lose purchasing power year after year. Unfortunately, this won’t stop—not as long as paper currencies and central banks define our monetary system. That’s why it’s imperative to always own gold—it’s the ultimate defense against currency debasement.
As the chart below illustrates, from 1920 to 2025, the U.S. M1 money supply—which includes the most liquid forms of money such as currency in circulation, demand deposits, and other checkable deposits—has skyrocketed by an astonishing 86,000%, rising from just $21.5 billion to a staggering $18.5 trillion.
While the U.S. dollar was once backed by gold, that backing was steadily diluted over the decades until it was fully abandoned on August 15, 1971. (I’ve written a full article detailing how that happened—be sure to check it out.) This relentless erosion of the dollar’s integrity, combined with unchecked money creation, steadily undermined its value over time—a process we know as inflation.
Make no mistake: inflation isn’t fundamentally caused by wars, supply shocks, strikes, droughts, or energy crises. At its core, inflation stems from the debasement of currency itself. As Nobel Prize–winning economist Milton Friedman famously put it, "Inflation is always and everywhere a monetary phenomenon."
And while I’ve shown the chart of the U.S. dollar’s debasement here, make no mistake—it’s the exact same story for every other country that uses fiat money, which includes virtually every major nation on Earth. The names change, but the game remains the same.

So after examining the chart of the U.S. money supply over the past century, let’s now take a look at how much the cost of living has soared during that same period by reviewing the long-term Consumer Price Index (CPI).
As you’ll see, the U.S. didn’t experience persistent, steady inflation until after the Federal Reserve was established in 1913. From that point forward, the Fed gradually took steps that undermined the integrity of the dollar—causing its purchasing power to erode and the cost of living to rise. This long-term surge in the cost of living is a direct byproduct of the explosive growth in the money supply that we explored earlier.

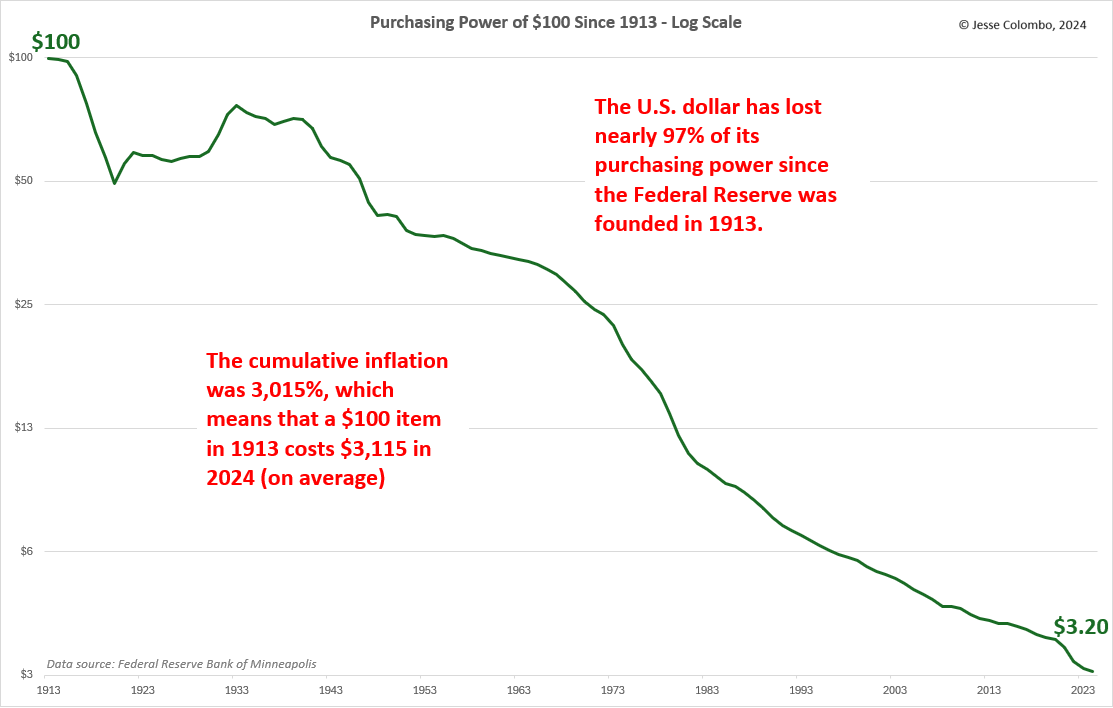
By using the same Consumer Price Index shown in the chart above, we can measure how drastically the U.S. dollar’s purchasing power has declined over time. Unfortunately, the data reveals that the dollar has lost nearly 97% of its value since the Federal Reserve was established in 1913 and began its steady dismantling of the dollar’s integrity. That’s a staggering figure: something that cost $100 in 1913 would cost $3,115 in 2024 purely due to inflation—in other words, the erosion of the dollar’s buying power.
Another powerful way to visualize—and further confirm—the dollar’s dramatic loss of purchasing power over the past century is by charting how many ounces of gold $1,000 can buy. Around 100 years ago, $1,000 would buy 51.95 ounces of gold. But as the dollar was gradually debased, it bought less and less—until today, when $1,000 purchases just 0.31 ounces of gold. That represents a staggering 99.4% loss in the dollar’s purchasing power relative to gold over the past century. This aligns closely with the CPI-based chart shown earlier, reinforcing the same harsh reality from a different angle.