


A Look at Where Gold & Silver Stand
Both gold and silver are undergoing healthy consolidation phases after their strong rallies, allowing them to reset and work off overbought conditions.

It’s been a couple of weeks since my last technical analysis on gold and silver, so it’s time for an updated look at where things stand. In my previous gold-focused update on April 22nd, I suggested that gold may have temporarily peaked after a strong rally, and that a period of sideways movement or a minor pullback would be both healthy and necessary to cool off its overbought condition. That’s exactly what we’ve seen since—gold has moved sideways, consolidating its gains. In this update, I’ll share what I’m seeing now and what I believe is likely to happen next.
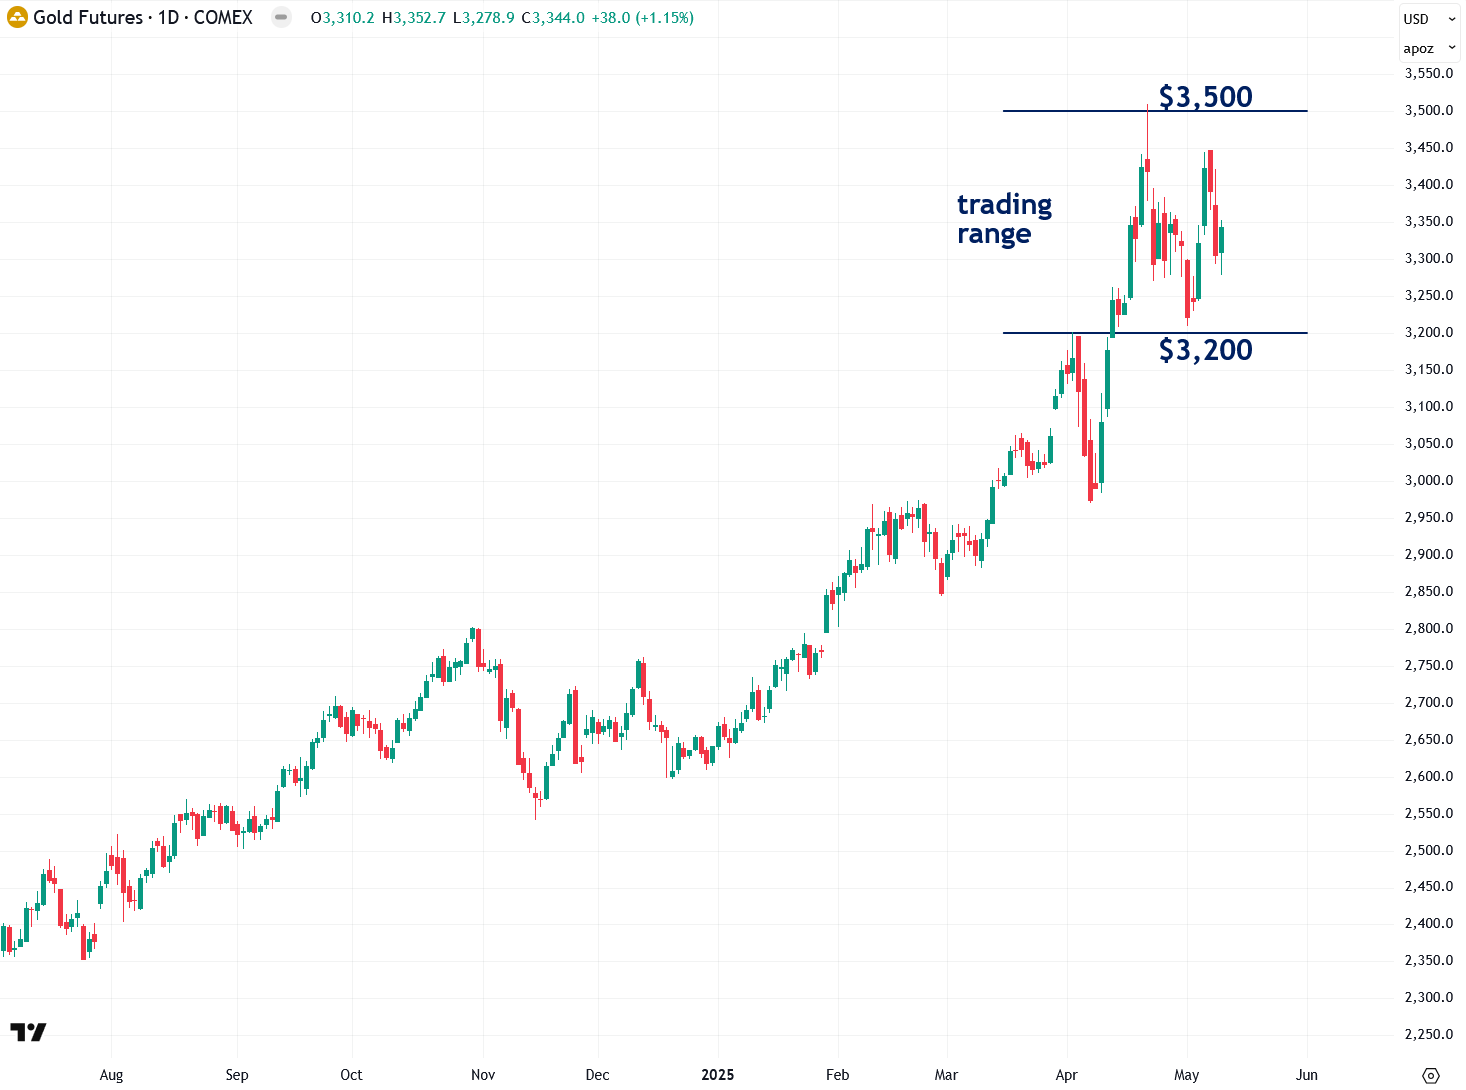
For technical analysis purposes, I prefer to focus on COMEX gold futures rather than spot prices, as futures tend to respect and form support and resistance levels in clean $100 increments—such as $3,000, $3,100, $3,200, and so on. Since peaking on April 22nd, when gold briefly tested $3,500 before pulling back, futures have been consolidating in a range between $3,200 and $3,500.
This type of sideways action is common in strong bull markets and often serves as a launchpad for the next leg higher. I’m currently watching for a breakout scenario, which would be confirmed by a decisive close above $3,500 on strong volume. If that occurs, I believe gold could surge to $4,000 an ounce fairly quickly—echoing a recent forecast by JP Morgan. I’ll be monitoring this closely.
Back on April 22nd, I pointed out that a candlestick pattern known as a spinning top had formed in gold—a classic sign of indecision that often marks the end of a rally. I suggested that this could signal a temporary peak and the start of a consolidation phase, which is exactly what we’re seeing now.
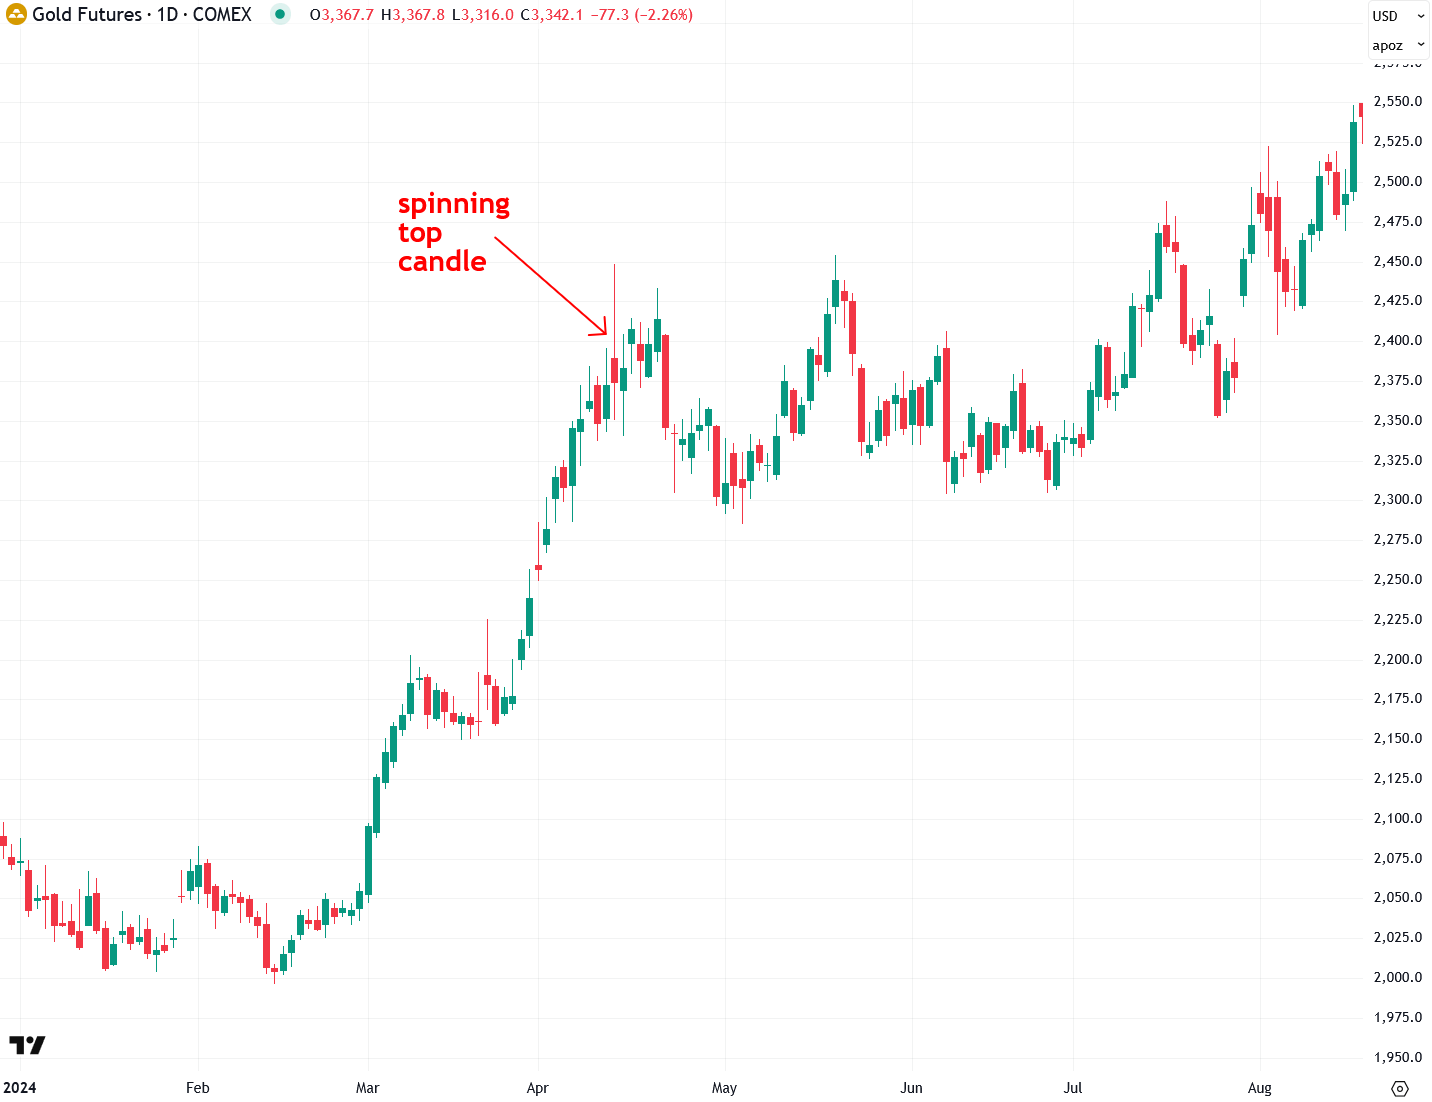
Interestingly, almost exactly one year ago, a spinning top candlestick appeared around the $2,400 level following gold’s surprise $400 rally (see the chart below)—and that marked the beginning of several months of consolidation before gold broke out again in August 2024. I see strong parallels between that April 2024 candle and the one we just saw in April 2025.
If this pattern holds, gold is likely to continue moving sideways for a few more months in a healthy pause before making another run higher. I welcome this kind of consolidation—it's far better for gold to build a solid base than to surge too quickly and risk a sharp correction.
One useful way to gauge whether an asset has surged too far, too fast is by comparing its price to its 200-day moving average. When an asset becomes significantly stretched above its 200-day moving average, it often signals that a consolidation phase is due—but that doesn’t necessarily mean a sharp pullback. It can take the form of sideways movement as the market digests recent gains.