

It’s time for a weekend precious metals and miners update. I held off until Sunday to publish this one, as there are more charts than usual and I wanted to cover the rapidly accelerating bust in the semiconductor and AI stock mania and its potential implications for precious metals.
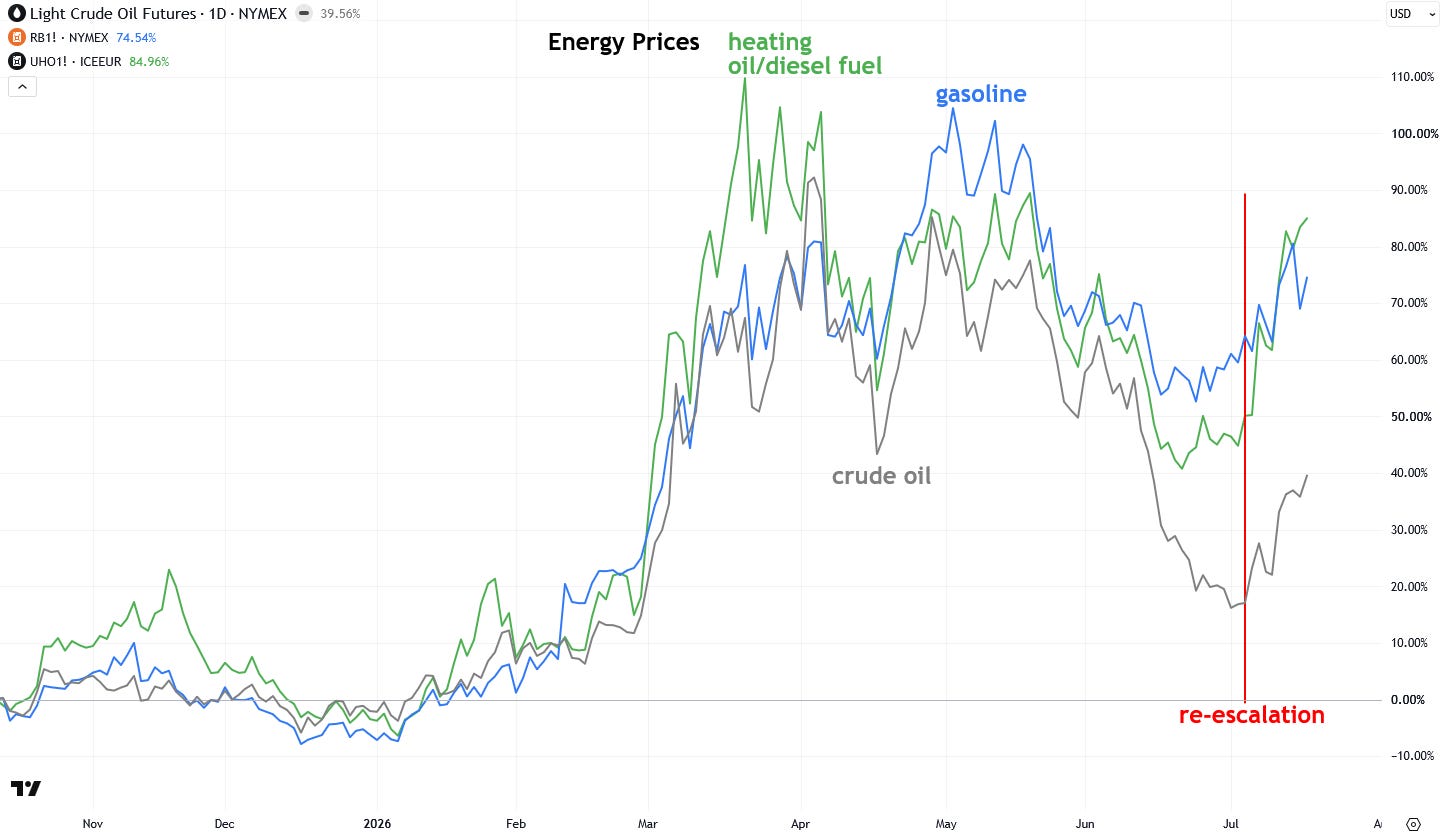
Checking in with energy prices, crude oil, gasoline, and heating oil/diesel all moved higher over the past week as the U.S.-Iran conflict intensified. Refined products such as gasoline and diesel have been rising faster than crude in recent weeks, a dynamic with strong inflationary implications. If these elevated prices persist and the conflict does not ease, it will become a meaningful headwind for the Republican Party heading into the midterm elections this fall.
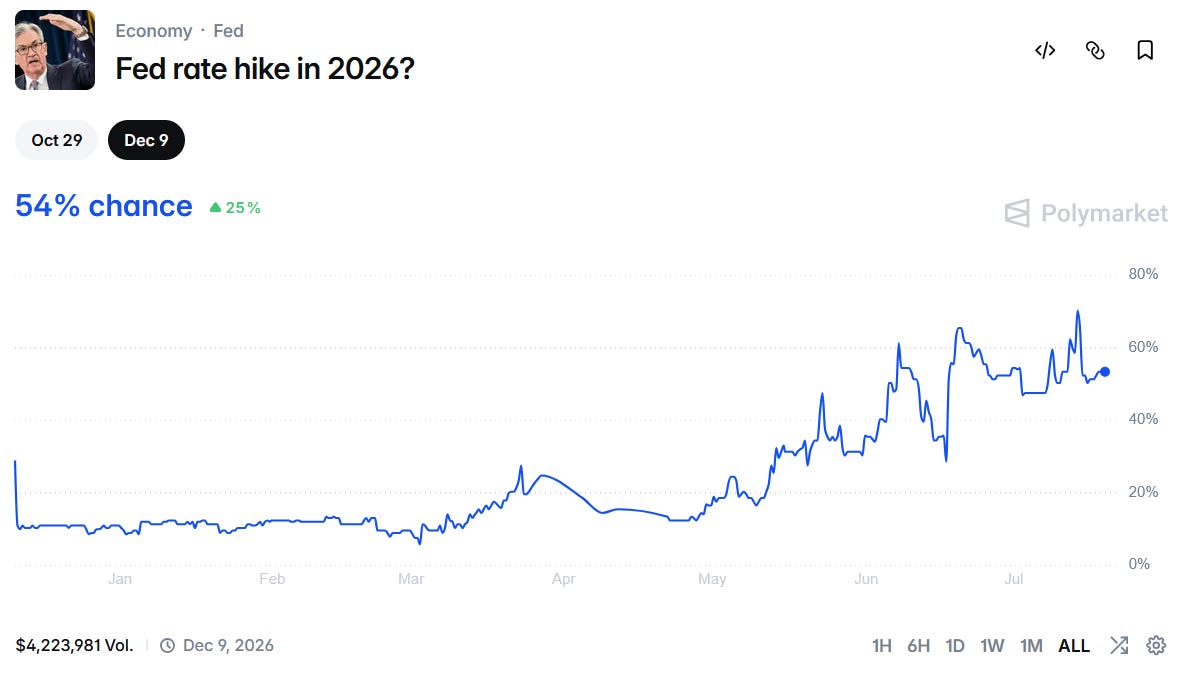
While rising energy prices have pushed the probability of 2026 U.S. rate hikes to 54%, those odds have declined from 71% following Tuesday and Wednesday’s weaker-than-expected June CPI and PPI inflation reports. However, July inflation is likely to reaccelerate, given the rebound in energy prices so far this month.
As a reminder, precious metals are sensitive to interest rate expectations because they are non-yielding assets, and they received some support over the past week as rate hike odds declined. The next Fed meeting is on July 29, and while rates are expected to remain unchanged, it is a highly anticipated event, with comments from Fed Chair Kevin Warsh and the updated dot plot likely to serve as important market-moving catalysts.
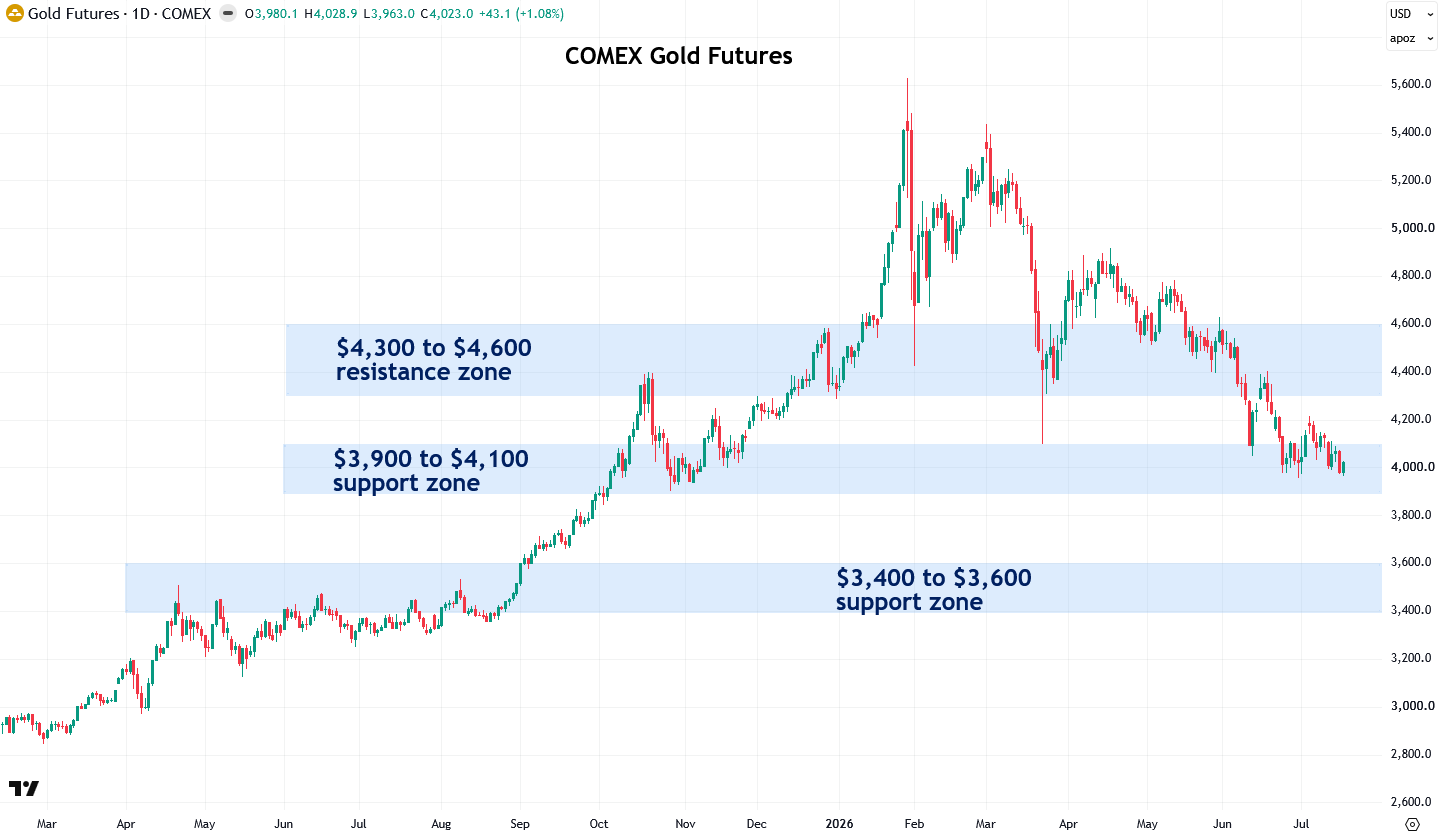
Now let’s take a look at where precious metals stand, starting with gold, which leads the overall complex. Despite a couple of attempts to move lower during the week, gold rebounded on Friday and continues to hold above the $3,900 to $4,100 support zone, which is an encouraging sign.
As a reminder, the $3,900 to $4,100 support zone was established by the lows in October and November 2025.
Ideally, I would like to see gold continue to hold above the $3,900 to $4,100 support zone and rebound from it, with the next hurdle being the $4,300 to $4,600 resistance zone. A decisive break above that zone would signal that the recent weakness has run its course. This resistance was established over a nine-month period by the highs and lows from October through June.
To learn more about support and resistance zones, I recommend reading my two-part tutorial (Part 1 and Part 2).
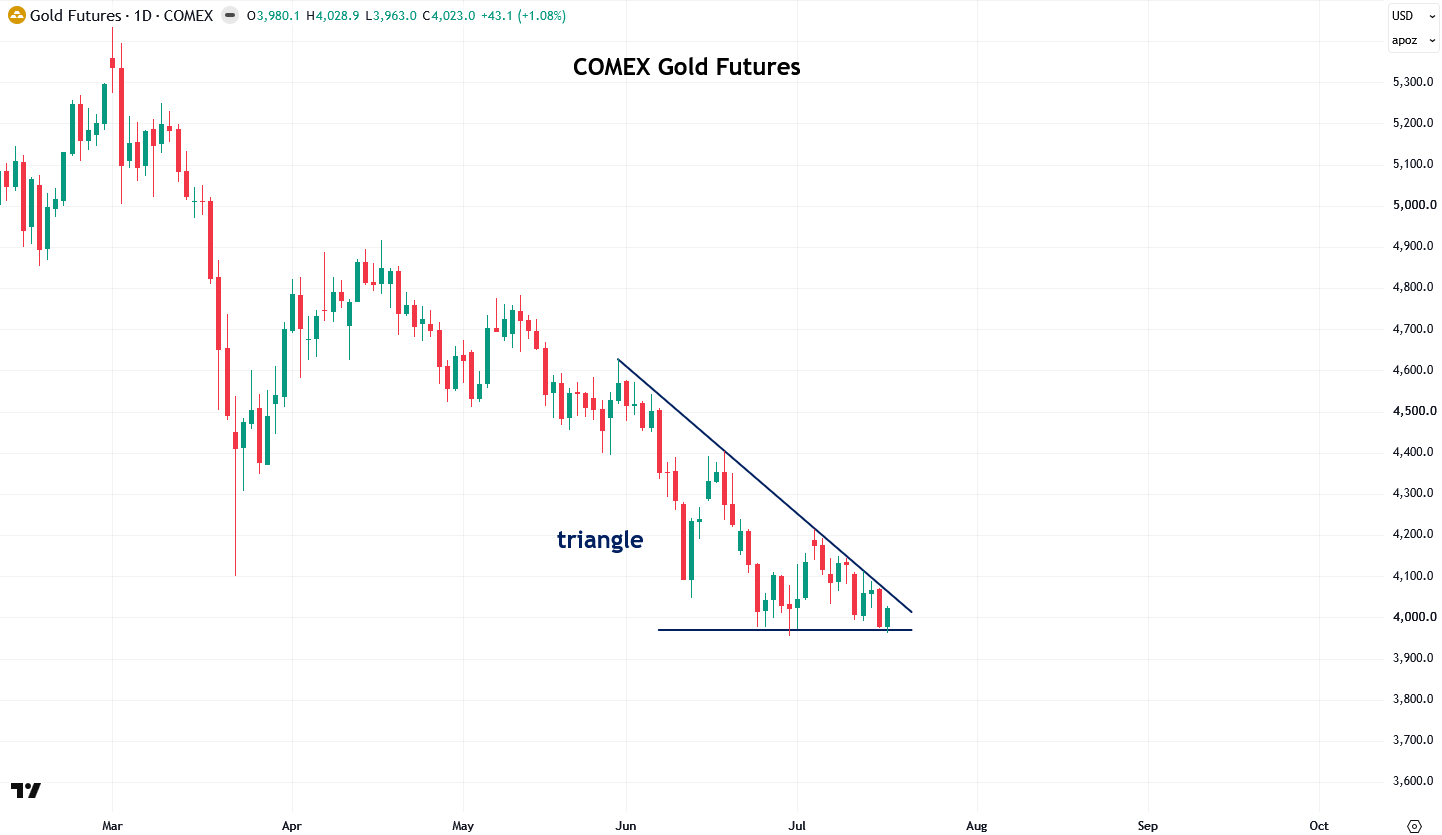
In my Wednesday update, I showed how a triangle pattern had formed in gold over the past month and a half. I believe gold is approaching a sharp move as it breaks out of this formation in one direction or the other, though I am not attempting to predict which way it will go, as I prefer a reactive approach and let the market reveal its direction.
My hope is that gold continuing to hold support, combined with oversold conditions, terrible investor sentiment, weakness in the dollar, and the unwinding of the semiconductor and AI stock mania, which I’ll discuss shortly, will set the stage for an upside breakout. Of course, confirmation is key.
I find it encouraging that gold rebounded off the triangle’s support on Friday, and I would like to see that momentum carry into the coming week, leading to an upside breakout, which I believe would mark the end of the recent weakness and the start of the next leg higher in the bull market.
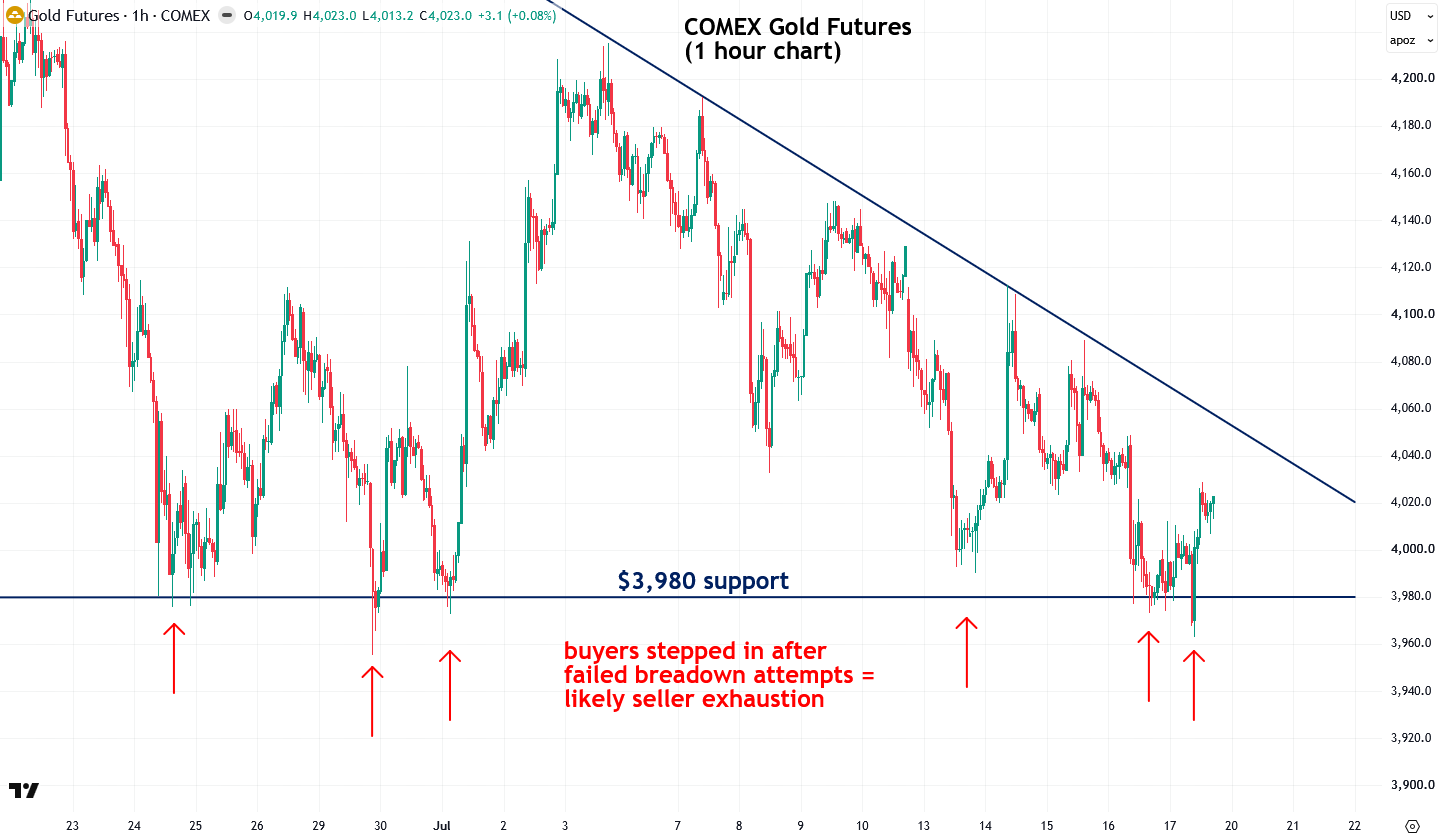
Zooming in on gold’s 1-hour chart, there have been at least six attempts to break below the triangle’s support near $3,980, but each one failed as buyers stepped in to buy the dip. This repeated inability to break lower indicates that gold has had ample opportunity to continue down but hasn’t, which I take as a sign that selling pressure is becoming exhausted, an encouraging development for gold bulls.
Of course, the situation remains fluid, with surging energy prices, the ongoing Iran conflict, and the upcoming Fed meeting all representing important risks. I would feel much more encouraged if gold can break out to the upside from the triangle with strong volume for additional confirmation.
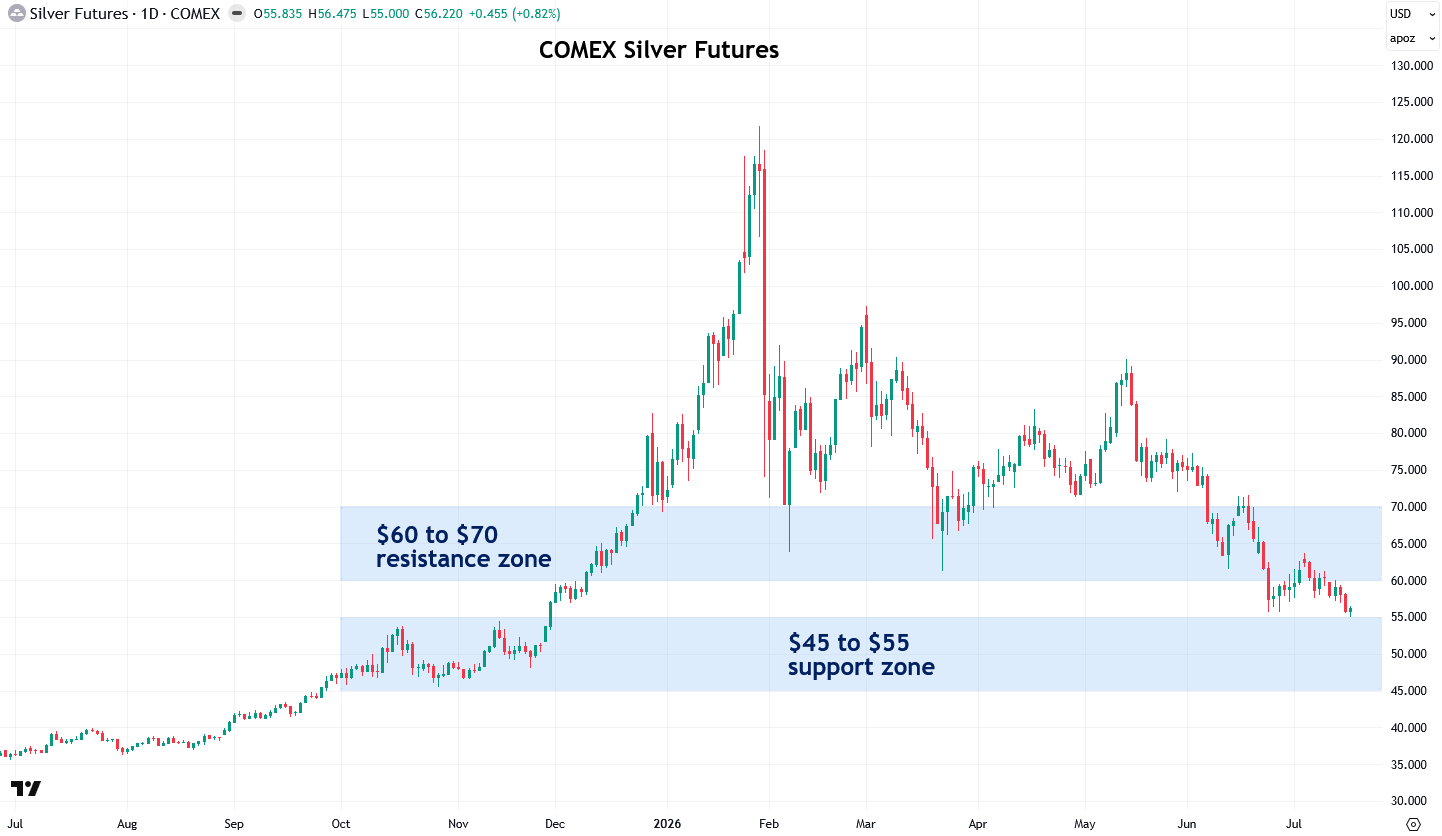
Similar to gold, silver also rebounded on Friday from the $45 to $55 support zone, which was formed by the highs and lows of October and November 2025, which is encouraging.
Assuming silver continues to hold above the $45 to $55 support zone and continues to rebound, likely in line with the direction of gold’s breakout from its triangle, I would then like to see it break above the $60 to $70 resistance zone to confirm that the correction has run its course. This zone was established by the lows from December through June.
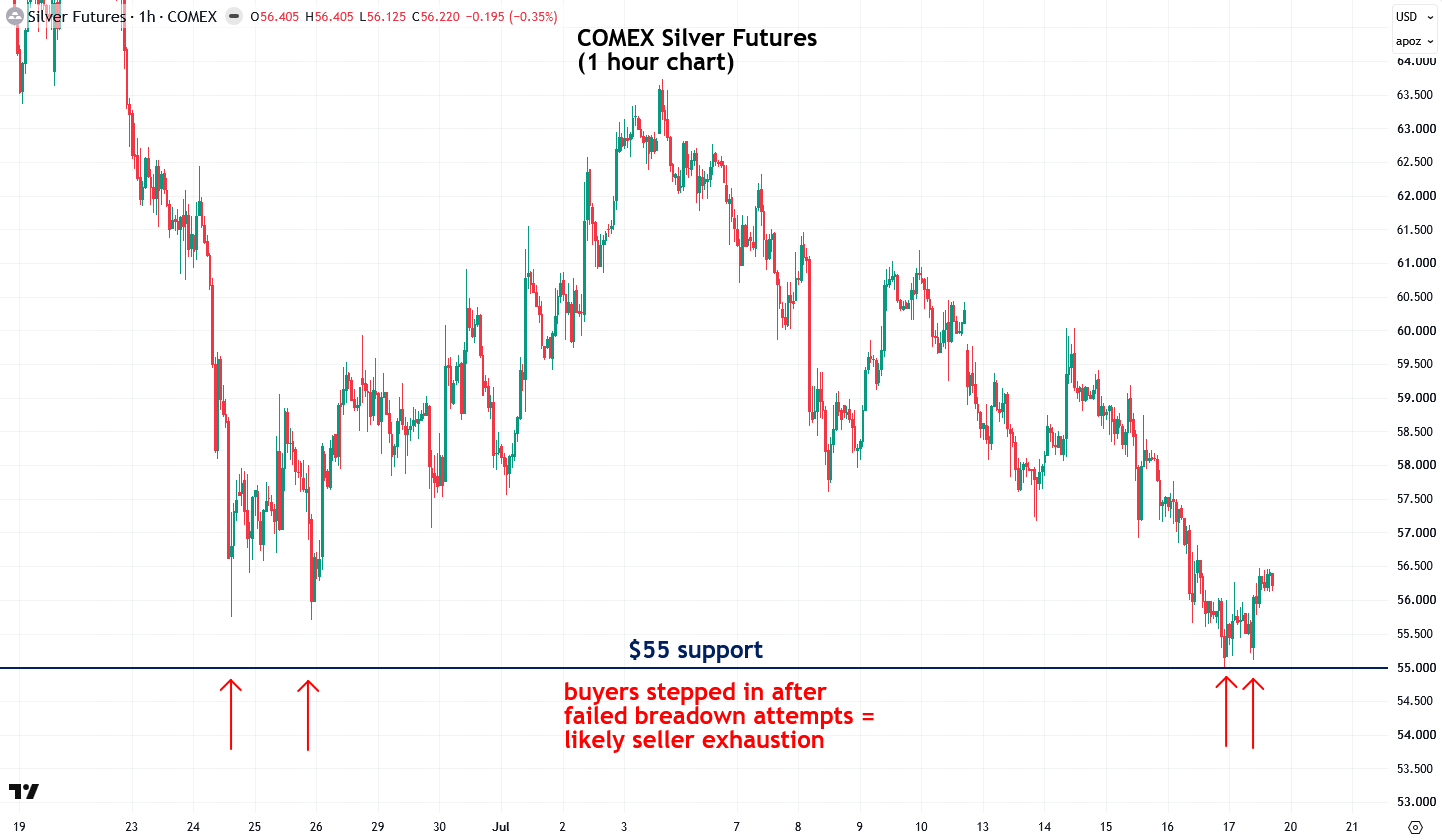
Zooming in on silver’s 1-hour chart, it has clearly been holding above the key $55 support level, despite several attempts to break below it. Each time, buyers stepped in to buy the dip, which may be a sign that selling pressure is becoming exhausted.
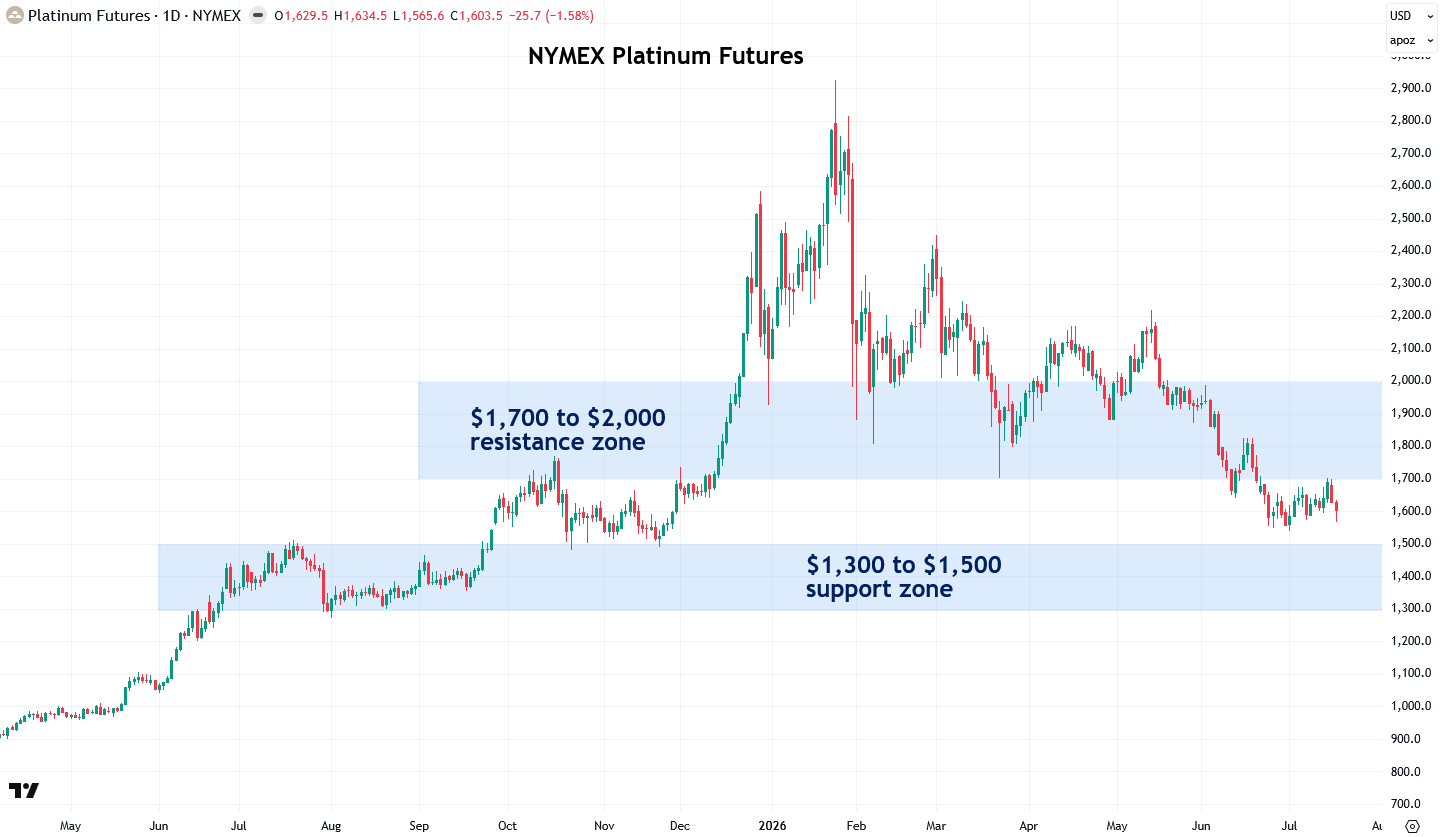
After rebounding in late June and early July, platinum has run into resistance at the $1,700 to $2,000 zone, which has developed over the past ten months, and has since pulled back modestly.
Still, it is encouraging to see platinum holding above the $1,300 to $1,500 support zone. I would like to see it break through the $1,700 to $2,000 resistance zone just overhead to confirm that the recent weakness has run its course, with gold’s breakout from its triangle likely to be the key factor determining platinum’s next move.
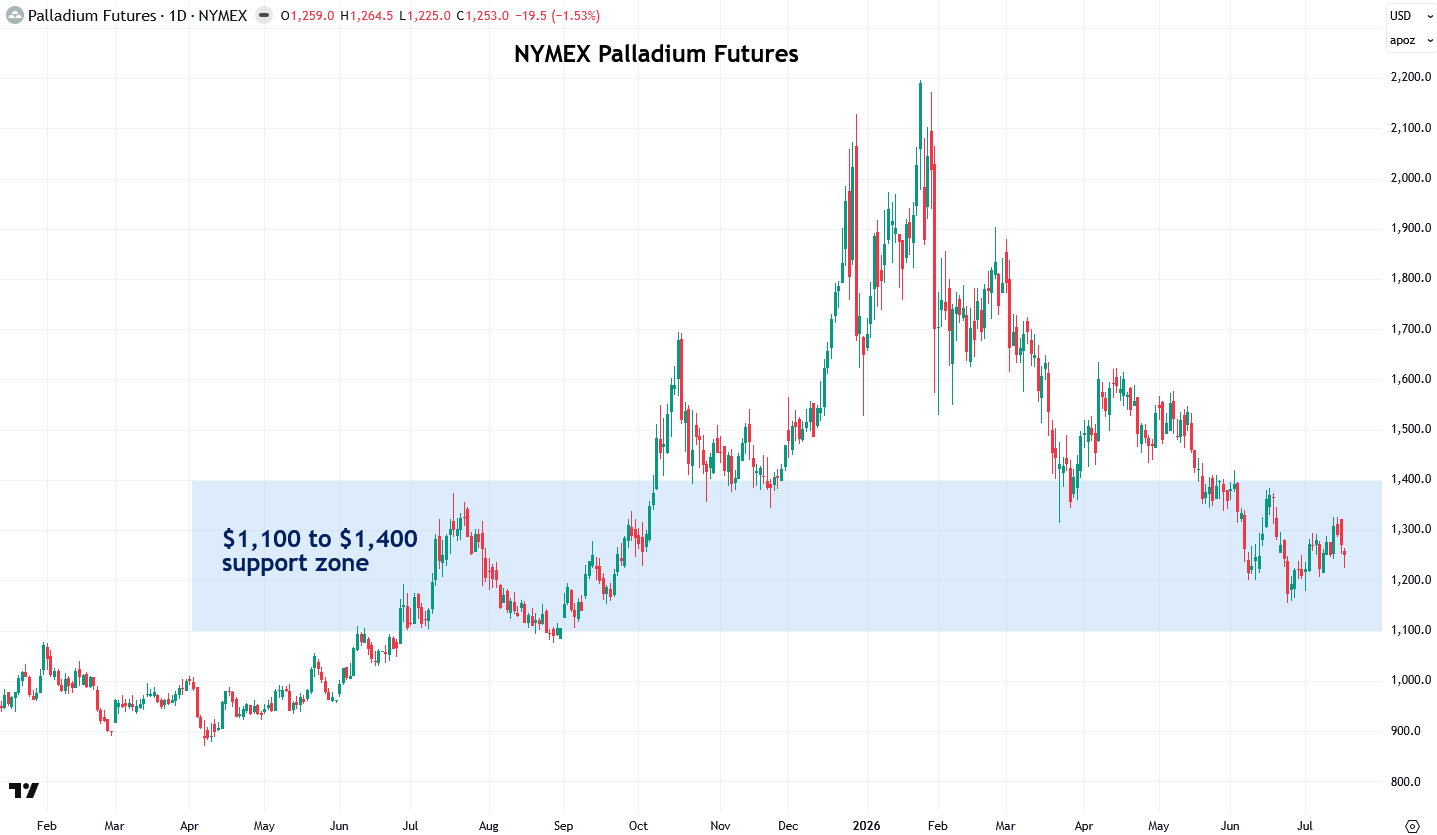
In line with platinum, palladium pulled back slightly toward the end of the week but continues to trade within its $1,100 to $1,400 support zone, which was established by the highs and lows of last summer. A decisive move above this zone would be an encouraging sign that the worst is likely behind it.
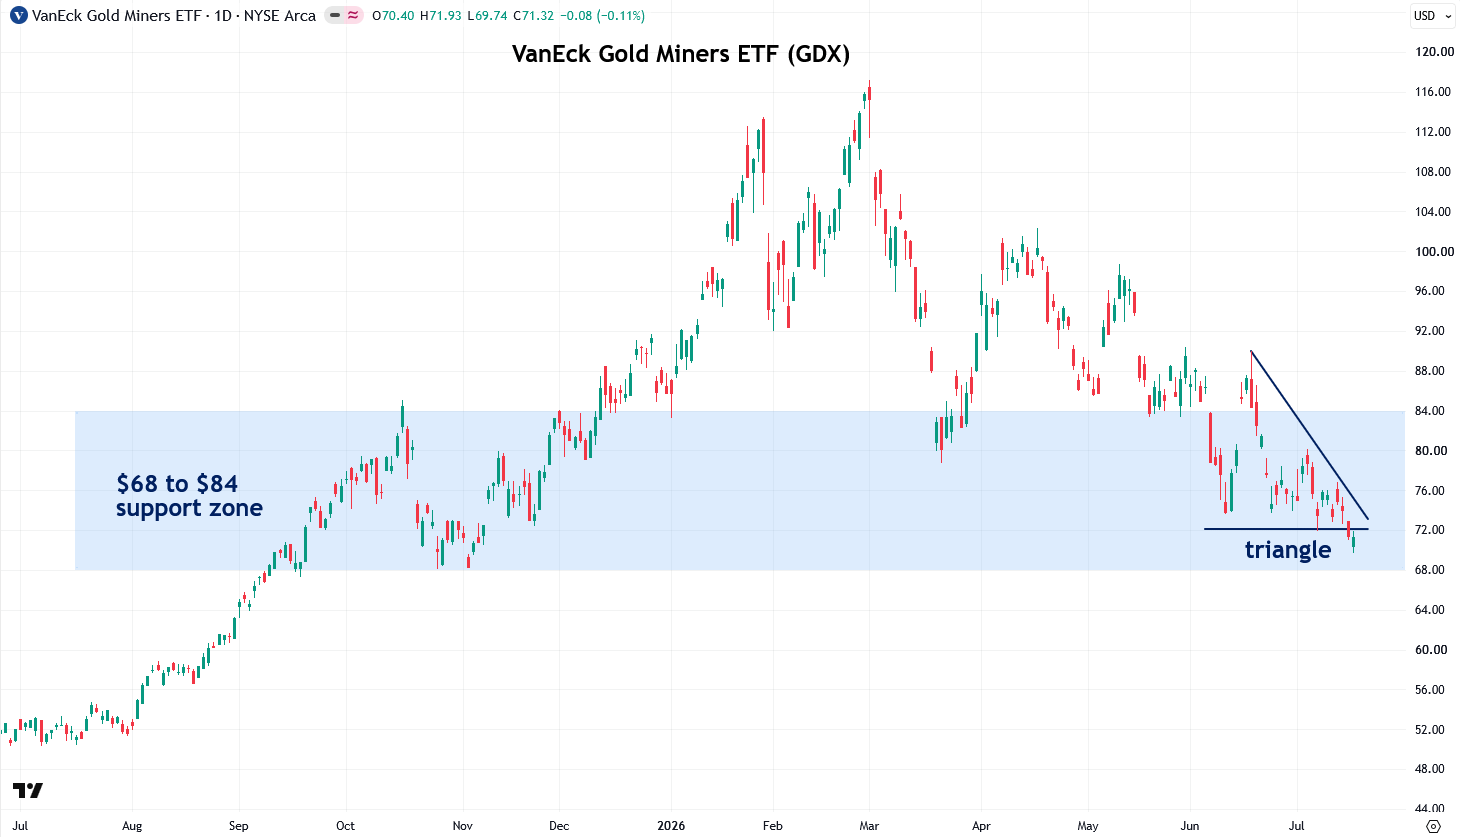
Gold miners, as represented by the VanEck Gold Miners ETF (GDX), slipped slightly below the lower boundary of their triangle pattern on Thursday and Friday, but without much conviction, likely reflecting gold’s own lack of a downside breakout. As a result, I would not consider this a confirmed breakdown at this point.
The recent underperformance in gold miners relative to gold is almost certainly due to rising energy prices, as energy is one of the primary input costs in mining. As a result, how energy prices behave from here will be key for mining stock investors.
In addition, GDX continues to hold its $68 to $84 support zone, which is encouraging, and the direction of gold’s breakout from its triangle will be the key driver for gold miners in the near term. I would like to see GDX rebound from this zone to confirm that the recent weakness has run its course.
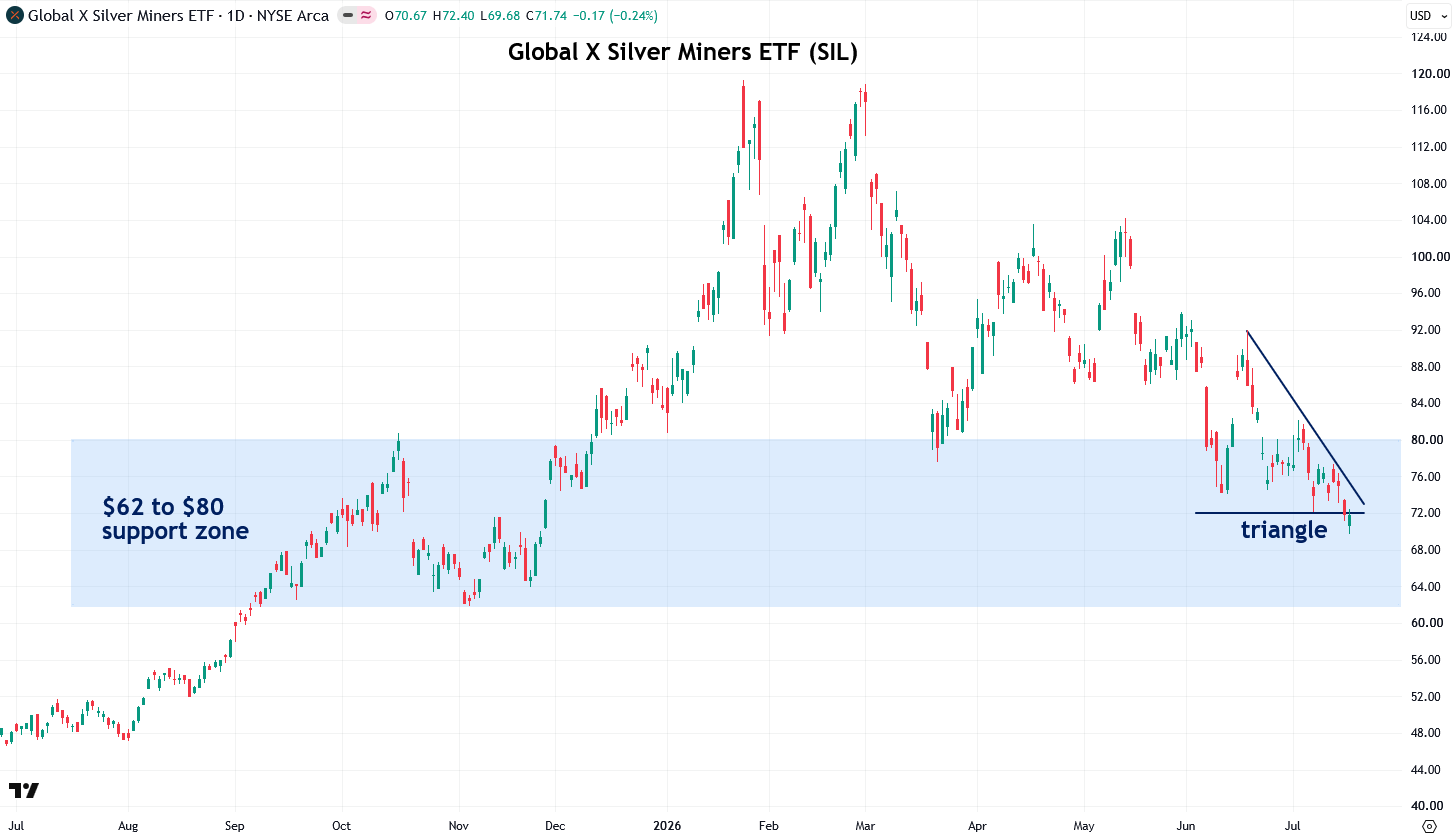
Silver miners, as represented by the Global X Silver Miners ETF (SIL), briefly broke below the triangle pattern but recovered much of those losses on Friday, so I do not consider this a confirmed breakdown at this time.
Like gold miners, silver miners are also being pressured by rising energy costs, so how energy prices trend from here will be an important variable.
SIL continues to hold its $62 to $80 support zone, which is encouraging, and I would like to see it push decisively above this zone to help confirm that the correction has run its course.
Next, let’s look at the U.S. Dollar Index, which is an important influence on precious metals and commodities and typically trades inversely with them.
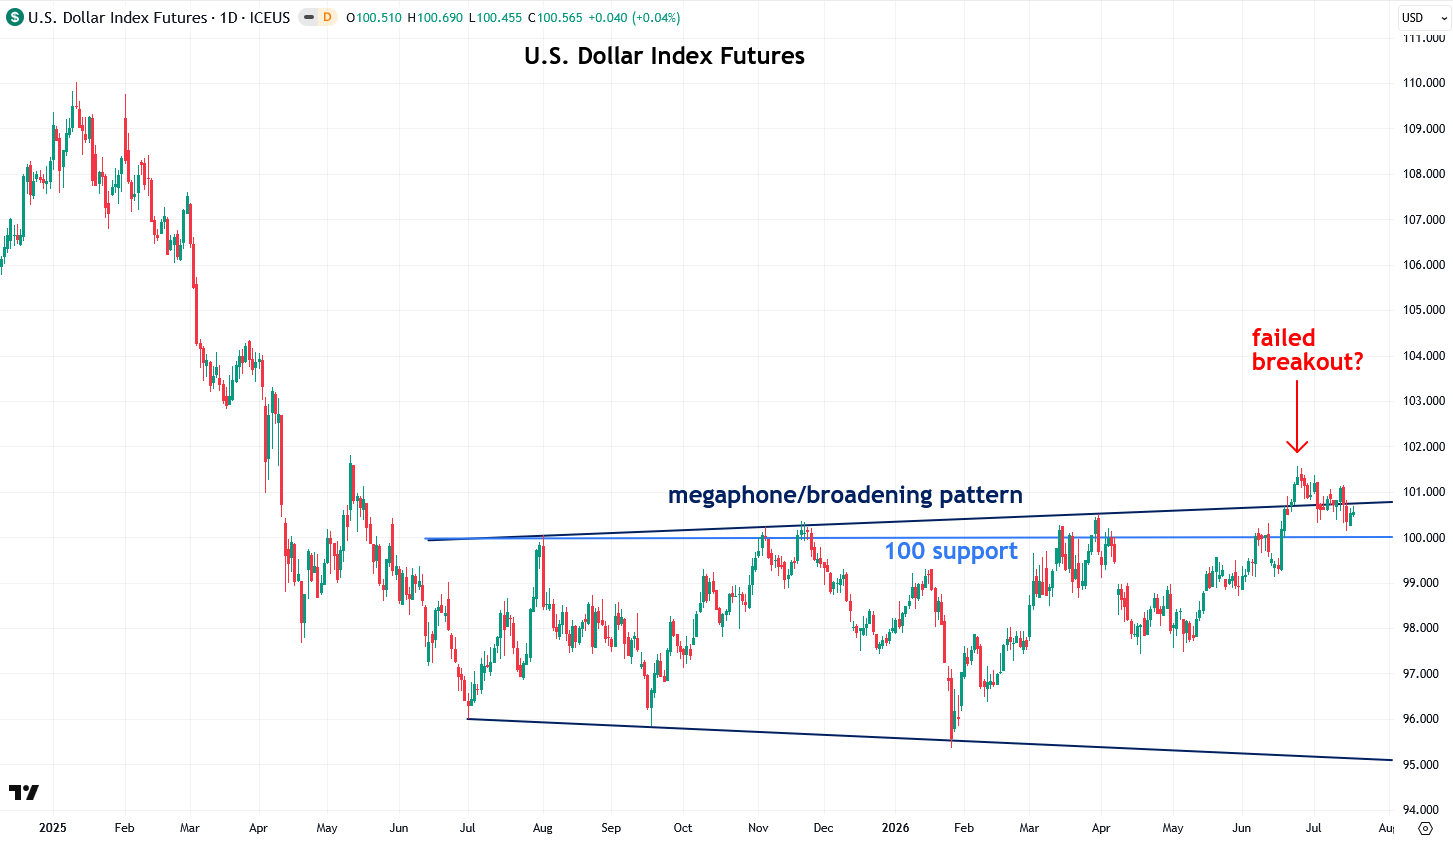
After attempting to break out of the broadening pattern that developed over the past year, the Dollar Index pulled back earlier in the week following cooler-than-expected U.S. inflation reports and the resulting decline in interest rate expectations.
This indicates that the dollar’s attempted breakout is, for now, appearing to fail, though I would like to see a decisive close below 100 for further confirmation, as that level is both psychologically very important and has served as a key support and resistance level in recent years.
A confirmed breakdown in the dollar would be a highly positive development for the precious metals complex, which typically trades inversely with the dollar. If that occurs, it should serve as a major catalyst to bring the correction that began in January to an end.
Key catalysts for the dollar over the next couple of weeks include energy prices, which tend to support the dollar when rising, the July 29 Fed meeting, and the potential for Japanese intervention to strengthen the yen, which would weigh on the dollar.
If you’d like to track the U.S. Dollar Index yourself, you can do so using this free chart from Finviz.
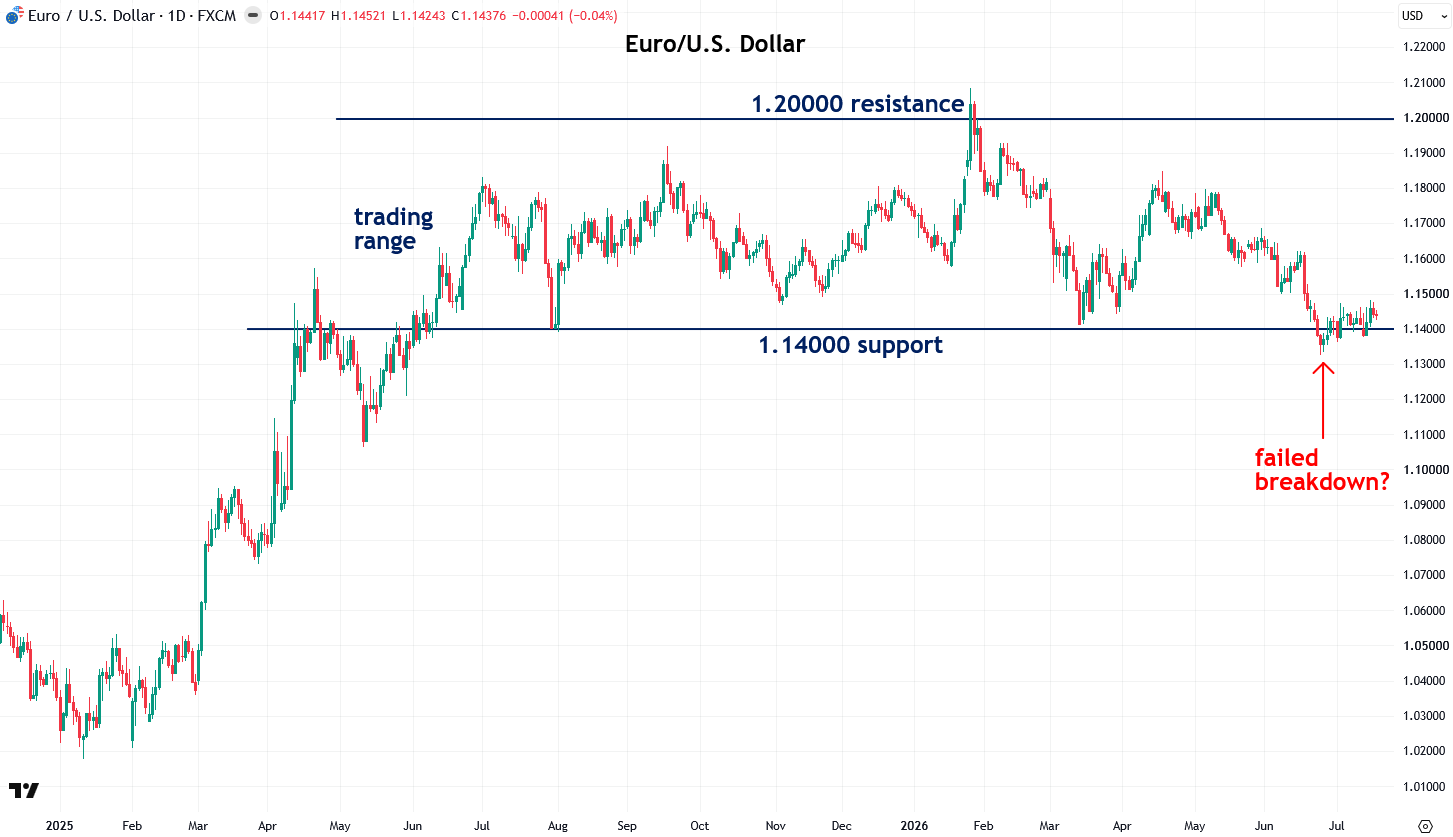
I have also been tracking the euro for additional insight into the attempted Dollar Index breakout, as it typically trades inversely with the dollar and often moves in positive correlation with precious metals.
Over the past year, the euro traded within a 1.14000 to 1.20000 range. It recently dipped below the 1.14000 support level but has since reclaimed it as the dollar pulled back, and it has strengthened further following the weaker-than-expected U.S. inflation reports. This price action adds to the case that the dollar’s recent breakout attempt has failed and that further downside may lie ahead.
If you’d like to monitor the euro yourself, you can do so using this free chart from Finviz.
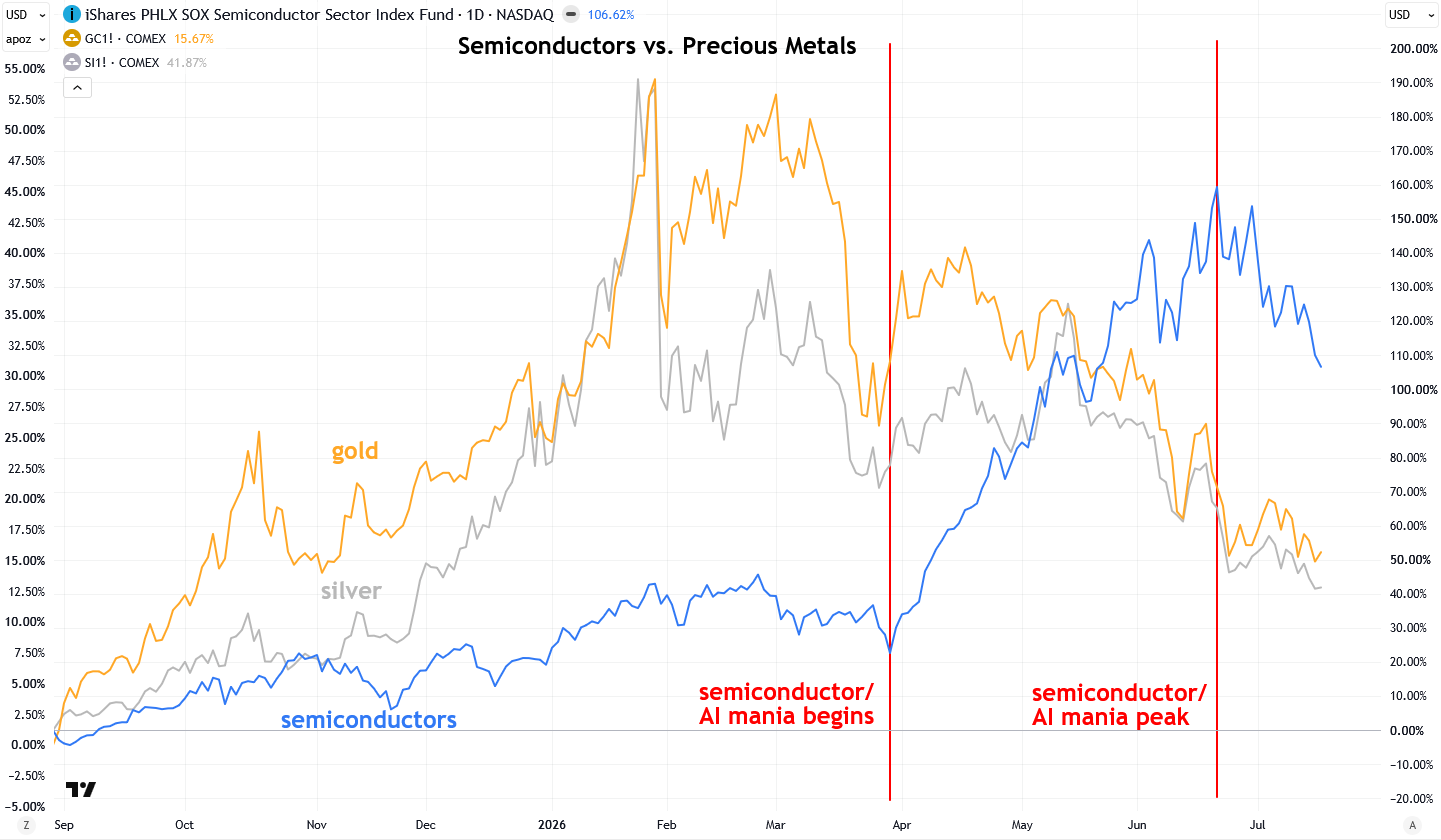
Now I want to discuss another important recent development for precious metals, which is the growing bust in the AI and semiconductor stock mania. After spending more time thinking through this, I have come to believe that a major driver of precious metals’ weakness this spring was the surge in AI-related stocks, which pulled significant capital away from metals and into the soaring tech trade.
The chart below compares gold and silver to the Philadelphia Semiconductor Index, and it clearly shows that the latest surge in the AI stock mania coincided with the downturn in precious metals.
Of course, correlation does not necessarily imply causation, but I do believe there is a connection here, particularly given that tech stocks and precious metals have often traded inversely, with capital rotating between the two in recurring cycles.
I believe this dynamic particularly impacted Asian investors, who have historically been strong buyers of precious metals but were recently swept up in the AI stock mania, especially in South Korea and Taiwan. As a result, capital temporarily shifted away from metals, though that may now be starting to reverse as the AI trade begins to unwind.
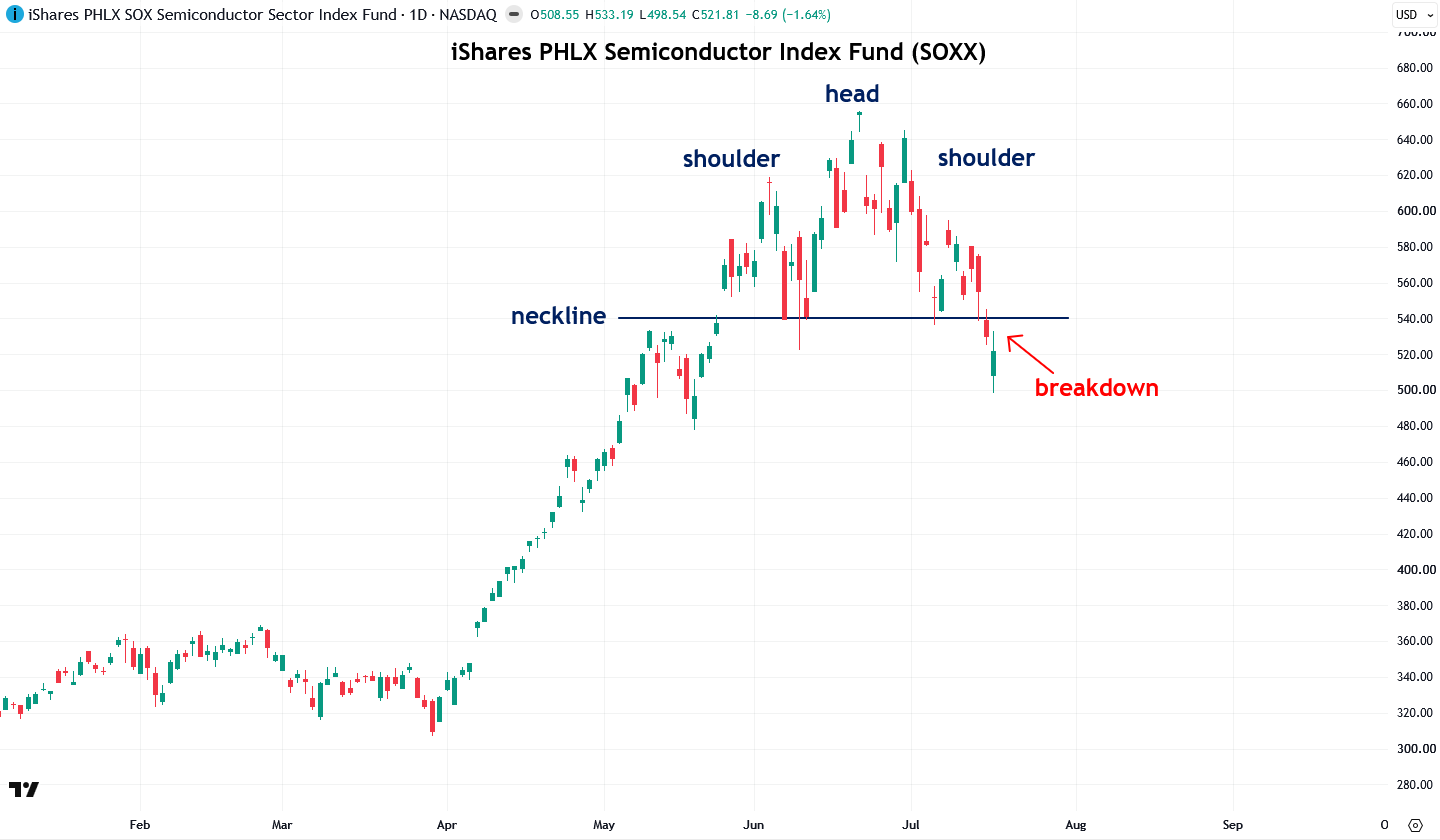
Looking at the semiconductor ETF (SOXX), it appears to have formed a classic bearish head-and-shoulders topping pattern that it broke down from on Thursday and Friday, and assuming this breakdown holds, it points to further downside in AI-related stocks.
This could be an exciting short opportunity for those skilled and experienced enough, though I am not recommending it as it is high risk.
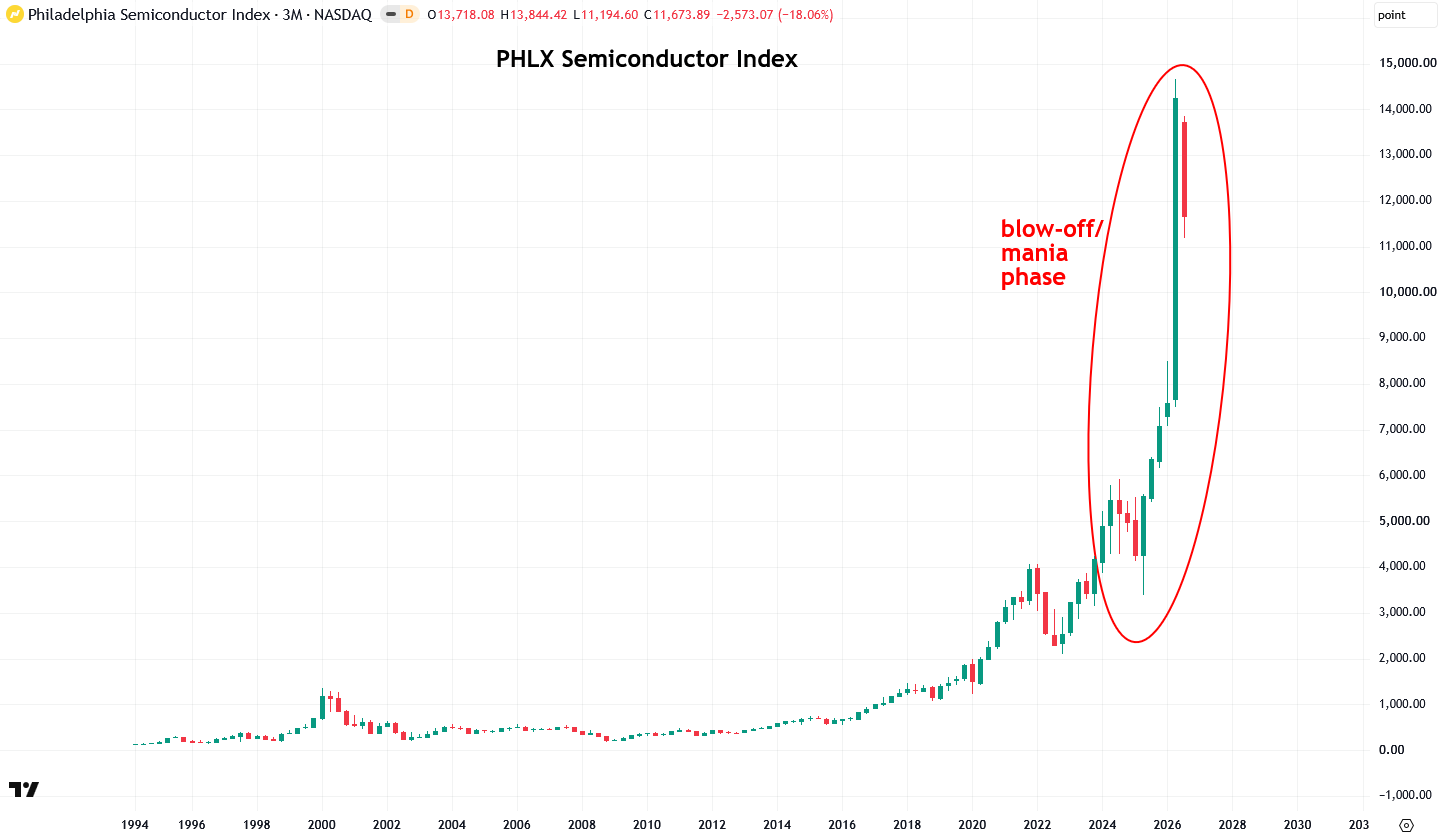
Looking at the longer-term chart of the Philadelphia Semiconductor Index shows a clear, classic blow-off mania phase in recent months, and such parabolic moves usually do not end well.
Just consider how much capital that surge pulled away from precious metals, and what will happen once it unwinds, which I see as highly beneficial for precious metals as investors come to their senses.
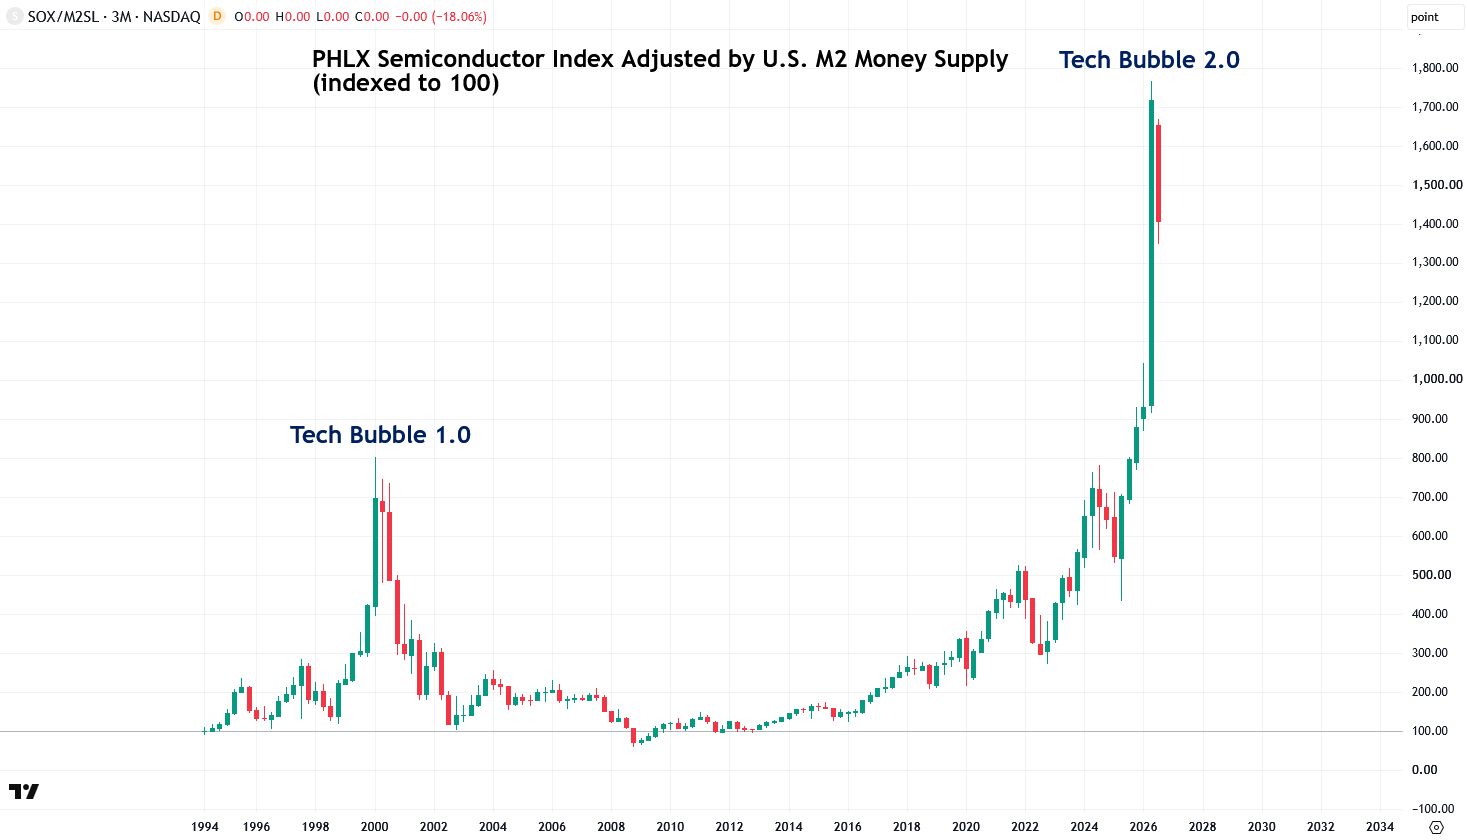
Adjusting the Philadelphia Semiconductor Index for U.S. M2 money supply, essentially an inflation adjustment, shows that the latest AI and semiconductor stock mania is even more extreme than the dot-com bubble of the late 1990s, and I see this one ending in a similar fashion.
Of course, I recognize that AI is a legitimate technology that is here to stay and will increasingly shape the future, but history shows that technology investments often get far ahead of themselves and need to correct those excesses. We saw the same dynamic with tech stocks in the late 1990s, even though the internet is now larger and more important than ever.
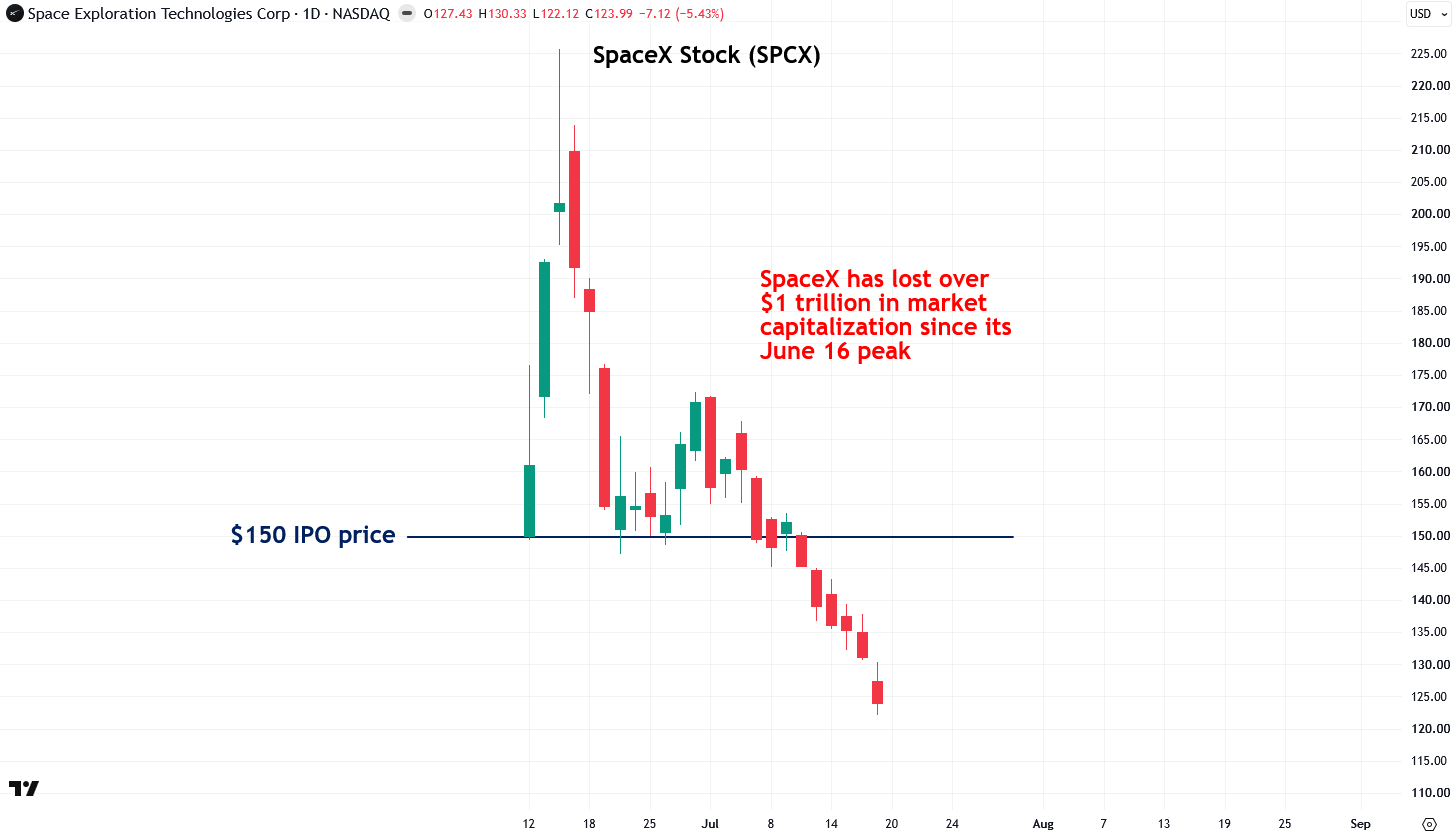
Another related factor that almost certainly contributed to the weakness in precious metals this spring was the enormous amount of capital being funneled into hot new tech IPOs, such as Elon Musk’s highly anticipated SpaceX offering, which raised a total of $85.7 billion and resulted in a staggering initial market capitalization of roughly $1.77 trillion, making Musk the world’s first trillionaire, at least on paper.
But as the tech hype has cooled recently, SpaceX stock has plunged from its peak of $225.64, falling below its $150 IPO price and now sitting at $123.99. That leaves every IPO buyer underwater and has wiped out over $1 trillion in market capitalization, a stark reminder of the risks of chasing hyped-up speculative tech stocks with little to no earnings.
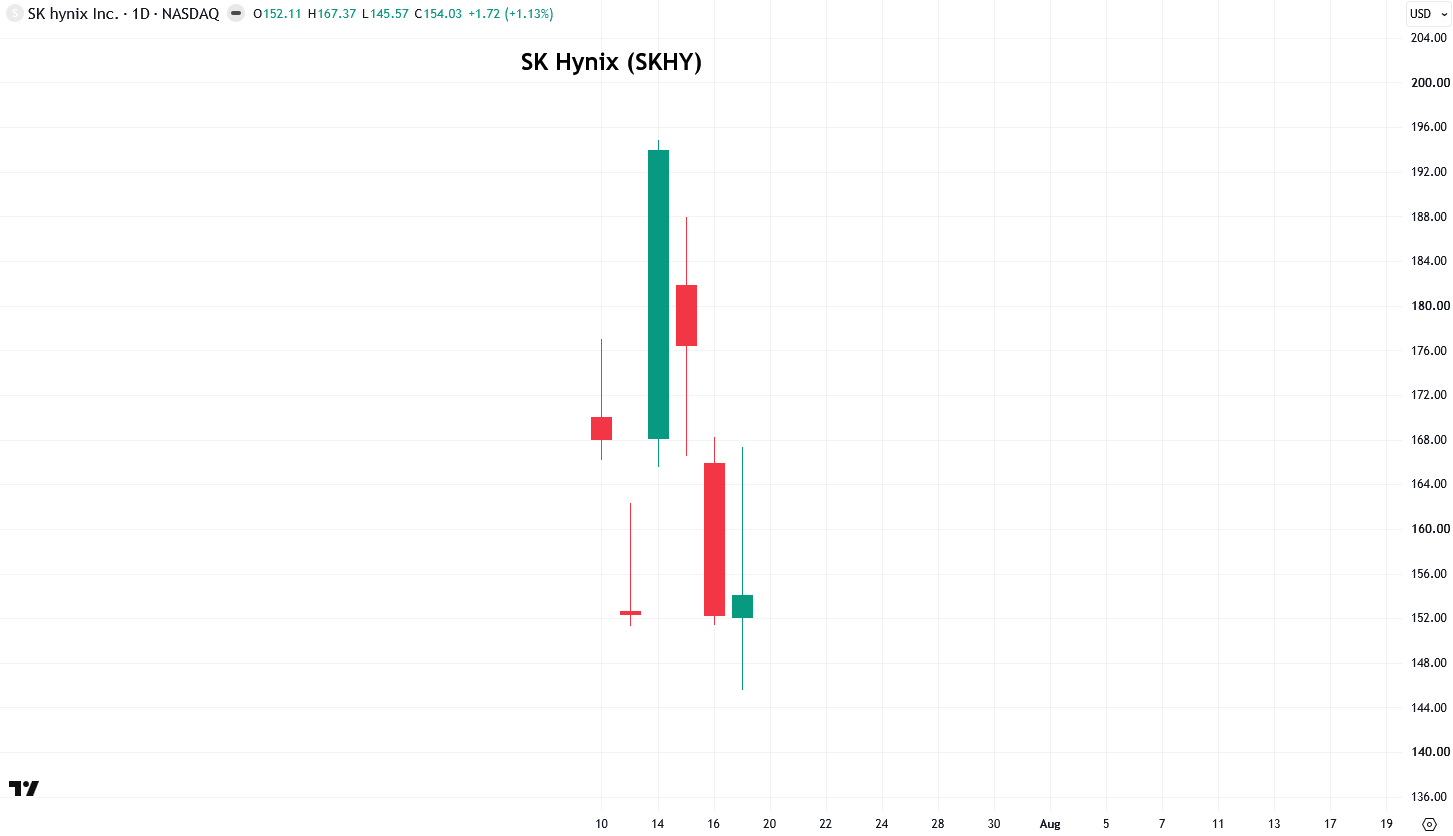
Another heavily anticipated and hyped tech offering was South Korea’s SK Hynix semiconductor stock, which recently debuted for trading in the United States, raising $26.5 billion and becoming more than seven times oversubscribed, driving its U.S.-listed shares to trade at over a 50% premium compared to those in South Korea.
Again, this offering was another shiny object that diverted attention and capital away from precious metals, which were undergoing a routine correction after two very strong years. But now SK Hynix stock is sinking in both South Korea and the United States, punishing investors who bought into the hype.
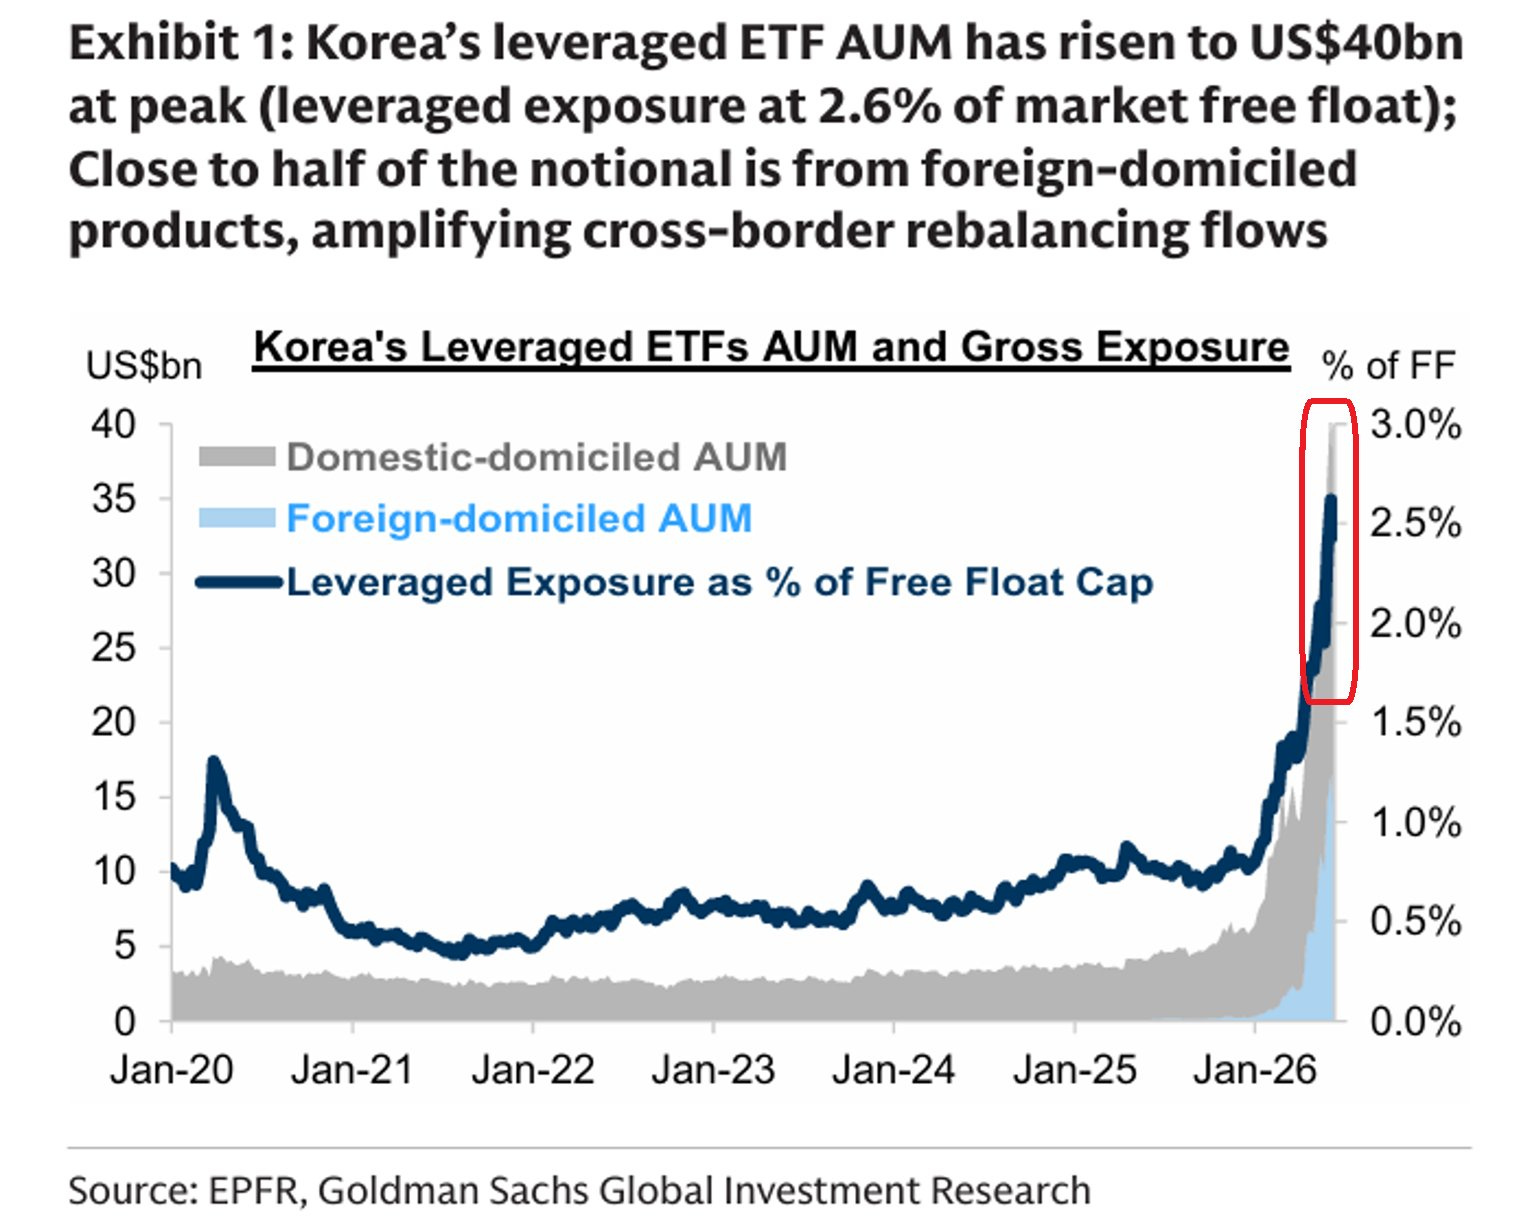
Further confirmation that the semiconductor stock surge is indeed a mania can be seen in the extent to which South Korean and Taiwanese investors have been leveraging themselves to get in on the action—piling into highly leveraged ETFs, borrowing aggressively, even mortgaging homes—in a rush to participate in the frenzy.
But with AI stocks now plunging, more than 1.2 million leveraged retail accounts across the Korean market have received margin calls in the past week, with approximately 320,000 to 360,000 accounts fully liquidated by brokers—roughly one in every 30 working-age South Korean adults.
This AI stock mania is eerily reminiscent of the Roaring Twenties in the United States, which culminated in the 1929 crash, when investors borrowed heavily on margin to speculate.
There is a very real risk that South Korea and Taiwan will face a similarly painful unwind, and hopefully investors will finally wise up, turn away from this folly, and back toward sound money in gold and silver.
To conclude, precious metals continue to hold their key support levels and have received a lift over the past week from cooler-than-expected U.S. inflation reports, though rising energy prices remain a key risk and will play a major role in determining the trend from here.
I am continuing to monitor the triangle pattern in gold and waiting for a breakout, with my hope being that sellers have become exhausted and that the unwinding of the AI stock mania leads investors to revisit precious metals as they redeploy capital away from the fading tech hype.
As a reminder, I firmly believe that precious metals and mining stocks are in the early stages of a long-term secular bull market that began in early 2024, and that the correction since late January is just that—a healthy pullback after two strong bullish years. I believe the upward trend will soon resume toward much higher levels, with gold surpassing $15,000 an ounce and silver reaching at least $300.
To reinforce my view that the precious metals bull market remains very much intact despite the 2026 correction, I have several major reports coming up that you won’t want to miss—so stay tuned, and I’ll continue to keep you updated on what I’m seeing.
Disclaimer: the information provided in The Bubble Bubble Report and related content is for informational and educational purposes only and should not be construed as investment, financial, or trading advice. Nothing in this publication constitutes a recommendation, solicitation, or offer to buy or sell any securities, commodities, or financial instruments.
All investments carry risk, and past performance is not indicative of future results. Readers should conduct their own research and consult with a qualified financial advisor before making any investment decisions. The author and publisher disclaim any liability for financial losses or damages incurred as a result of reliance on the information provided.
AI has been hot for about 2 minutes and precious metals have been hot for over 2 millennia, pretty easy to figure who's going to win
As always a strong update.
The rotation thesis is the most underrated idea here. If much of this spring's metals weakness was capital being vacuumed into the AI trade rather than anything changing in the metal, then it was always a flow story, not a fundamentals story. Flows reverse; deficits do not.
The Asian angle sharpens it: Korea and Taiwan are a structural pillar of physical demand that got pulled into leveraged semis. The margin calls are painful, but they are the mechanism that forces that capital back out, and cultural affinity means a lot of it drifts toward hard money, not the next hot ticker. The same rotation that starved metals becomes the fuel when it unwinds.
It also explains the divergence people keep puzzling over: paper making fresh lows while the physical market tightens into a sixth-year deficit. Confirmation is still everything. A dollar close below 100 and gold breaking its triangle on volume would turn "sellers look exhausted" into "the correction is over."