


Gold & Silver Market Update: Everything You Should Know Right Now
Discover the key price levels and charts to watch in gold, silver, and mining stocks—and why the long-term case for precious metals remains incredibly bullish, despite the obvious manipulation.

Financial markets have erupted with volatility following the Trump administration’s tariff plan announcement last Wednesday. Since then, nearly $10 trillion has been wiped out from the U.S. stock market alone. The current market selloff is drawing comparisons to the March 2020 plunge during the COVID lockdowns, with hedge funds once again facing steep margin calls. We're seeing widespread liquidation and a rush for cash and liquidity—an environment that, for now, has also dragged gold and silver lower, which is a typical pattern. That said, I’m not concerned, and I’ll explain why in this update.
Let’s start by looking at where gold, specifically in the form of COMEX futures, currently stands. I focus on COMEX futures because support and resistance levels often form cleanly at $100 intervals—$3,000, $3,100, $3,200, and so on. Following the tariff announcement on Wednesday night, gold hit resistance at $3,200 and has since pulled back to just above $3,000. This level is particularly significant, both technically and psychologically. I’m not concerned about the pullback—it’s a natural breather after such a strong rally. That said, I’d ideally like to see gold hold above $3,000 and bounce from there.

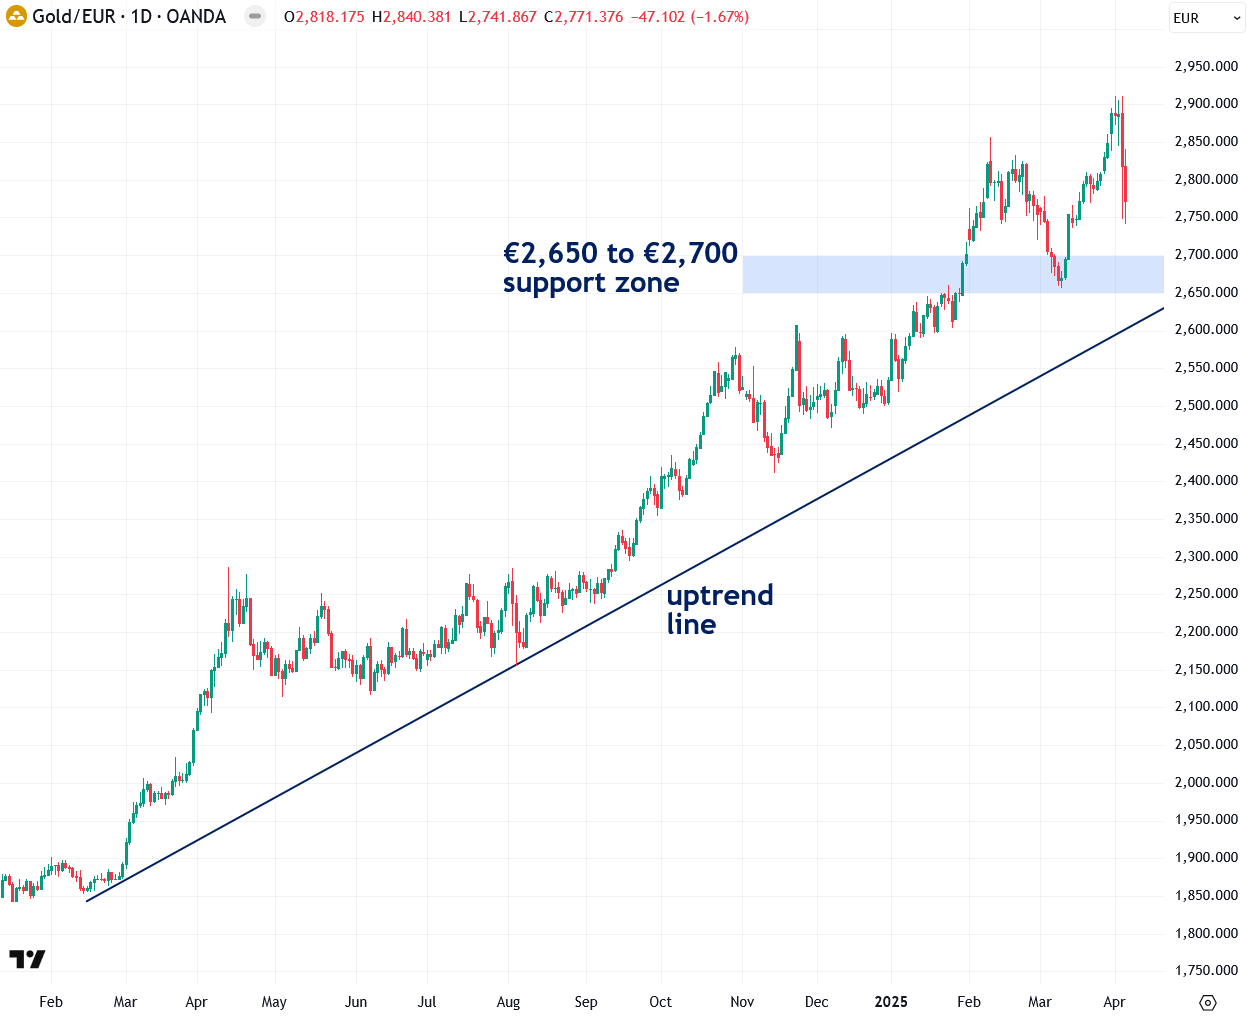
I also like to track gold priced in euros, as it strips out the influence of U.S. dollar fluctuations and gives a clearer picture of gold’s intrinsic strength. Recently, gold in euros reached the €2,900 level before pulling back. There’s now a key support zone between €2,650 and €2,700 that I’d ideally like to see hold. Importantly, gold priced in both euros and dollars remains in an uptrend, staying above the trendline that began in March 2024. As long as gold holds above that line, the year-long uptrend remains intact and my tactical bias stays bullish—though I remain long-term bullish regardless, with a minimum target of $15,000 an ounce.
I also like to look at gold priced in a basket of euros, British pounds, and Swiss francs for additional confirmation. This composite view often forms major support and resistance levels at 100-unit increments. Currently, there’s a key support zone between 7,200 and 7,400 just below the recent price action, and ideally, I’d like to see gold hold above this area and bounce from it. There's also an important uptrend line dating back to March of last year, which I’m closely watching—staying above it signals that the broader uptrend remains intact.

It’s important to keep the big picture in mind when evaluating gold’s long-term position. Just a year ago, gold broke out of a major, long-term cup-and-handle pattern—an event that marked the beginning of this bull market. As analyst Clive Maund recently noted, it's highly unlikely that such a significant breakout would lead to only a brief, one-year rally before fizzling out. On the contrary, this is more likely the first of many years in a sustained bull run. Even if gold pulls back or moves sideways for a few months, it doesn’t undermine the long-term bullish case signaled by that breakout or the fundamentals.