
Gold’s Volatility Squeeze Signals a Big Move Ahead
Some of the biggest market moves are preceded by periods of extremely low volatility, and that is exactly what is happening in gold right now.

Gold’s price action over the past five months has been slow and uneventful, with many investors growing bored, impatient, and even concerned that the top is in and the bull market that began in March 2024 is already over. As I’ve been explaining, however, this kind of sideways movement is normal and healthy as gold takes time to consolidate and digest its earlier gains, particularly during the summer when trading volume is light and Wall Street is in vacation mode. In today’s update, I want to highlight something else: gold is currently in a “volatility squeeze,” a technical setup that often signals a big move ahead and should be seen as a reason for optimism, not concern.
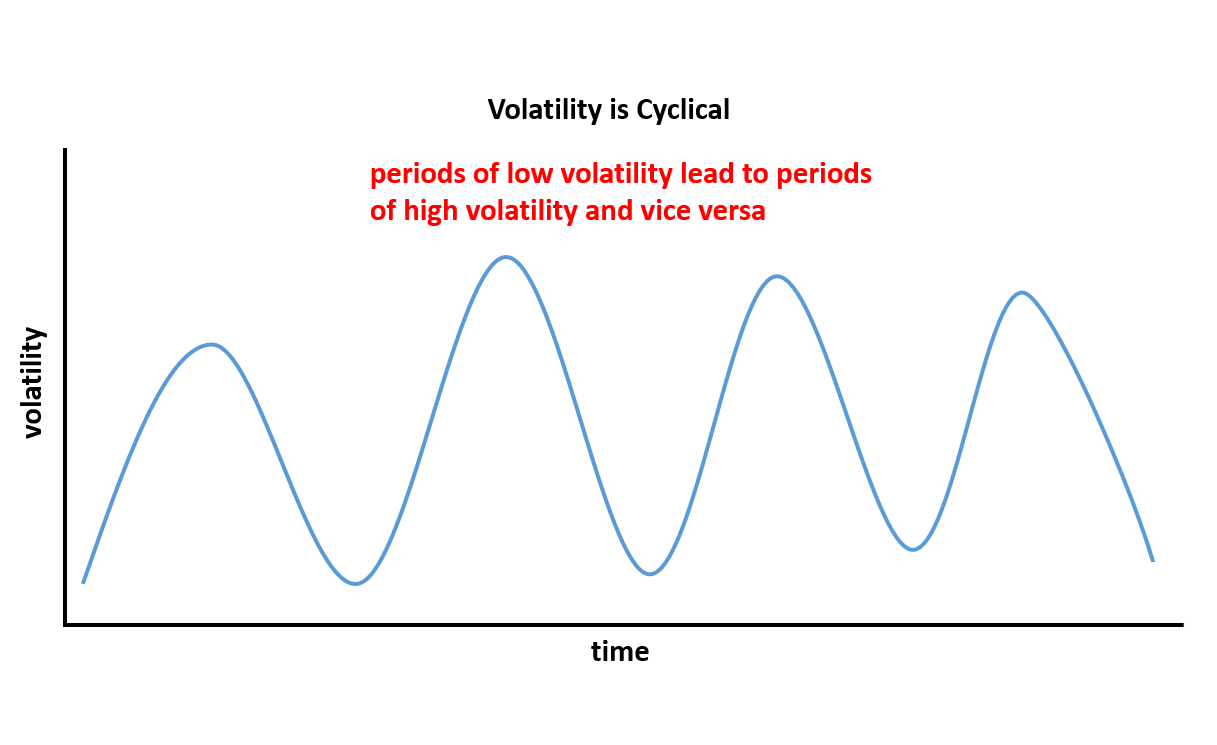
To better understand today’s lesson and update, it helps to know that volatility is highly cyclical. While asset prices like precious metals and stocks may not follow clear cycles, the volatility of those prices does—consistently moving through repeating phases of low and high volatility. Periods of quiet, low volatility tend to build pressure that leads to sharp spikes in volatility, which then eventually subside, starting the cycle again. See the diagram below for a visual of this repeating pattern.
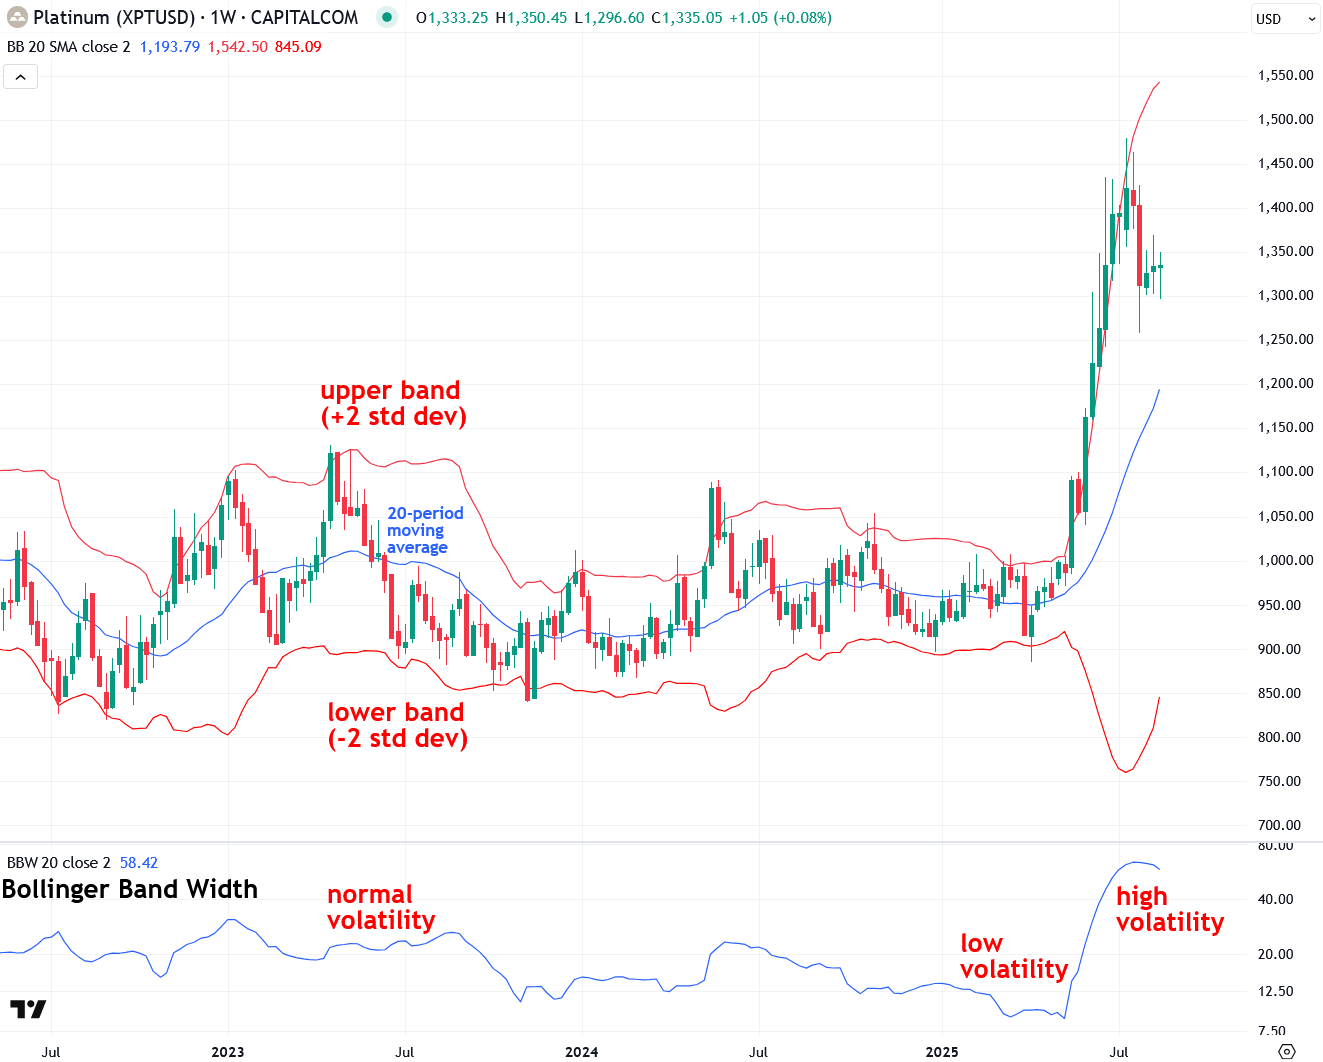
So how can volatility be measured and monitored in the real world? While there are a number of ways to do this, one of the most efficient and widely followed is to use an indicator called Bollinger Bands, which, when applied to a chart of an asset such as platinum in the example below, envelope the price. The way the Bollinger Bands indicator works is that it takes a 20-period moving average of the asset’s price (the blue line in the chart below), and then upper and lower bands (the red lines in the chart below) are plotted two standard deviations above and below the moving average.
There are several ways to use Bollinger Bands, such as treating the upper band as a resistance level and the lower band as a support level. However, that’s not the focus today. Instead, I’m going to focus on the width of the Bollinger Bands as a way to measure the volatility of the asset they’re applied to. Simply put, when the bands are close together, the asset has low volatility; when the bands are wide apart, the asset is experiencing high volatility—based on the past twenty trading periods, whether measured in days, weeks, or another timeframe.
While it’s easy to eyeball the Bollinger Bands to gauge their width and the asset’s volatility, there is another helpful related indicator called Bollinger Band Width that makes this even easier. You can see it plotted on platinum’s weekly chart below. The chart shows clear periods of normal volatility, low volatility, and high volatility. When an asset moves sideways for a while, volatility is low, and when it trends strongly either up, as platinum has in recent months, or down, volatility is high.
Next, I want to explain the powerful concept of a volatility squeeze using the same platinum chart as above, but zoomed in slightly. As mentioned at the start of this article, volatility is cyclical—periods of low volatility are followed by high volatility, and vice versa.
More specifically, periods of extremely low volatility, known as a volatility squeeze, often precede explosive volatility, known as a volatility breakout. This makes volatility squeezes highly valuable to watch for, as they frequently occur just before large, tradeable moves in either direction. In fact, a high percentage of major bullish and bearish moves in markets are preceded by these squeezes. Volatility squeezes can be thought of as a spring compressed under pressure that snaps back violently once released.
It’s also important to understand investor and trader psychology during volatility squeezes. During these periods the asset drifts sideways within a range, news flow is minimal, and boredom and discouragement set in as traders lose interest and shift their attention to more active markets. It’s often at that very point, when most eyes are elsewhere, that a major catalyst appears and propels the asset out of its volatility squeeze into a strong new trend.
Returning to the platinum example below, from March to May the metal entered a clear volatility squeeze, visible in the narrowing Bollinger Bands and confirmed by the Bollinger Band Width indicator beneath the chart. During this period traders grew bored and shifted their attention to more active markets.