
How to Confirm Breakouts Using Volume
Learn how to follow the smart money to determine whether a breakout is likely to succeed or fizzle out, illustrated with many examples from a wide range of financial markets.

In addition to providing precious metals market analyses and other economic reports, I also like to include tutorials that teach helpful tips and tricks to help subscribers become more competent and confident investors and traders, as well as to understand my analyses better.
In today’s tutorial, I am going to teach you how to use trading volume to confirm breakouts or not confirm them, which is a powerful but simple technique that greatly increases the probability of getting on board winning trades rather than ones that fizzle out quickly and trap you in a bad trade. I will show many examples of this in a wide variety of different assets and then show you what it is telling about gold and silver right now.
Trading volume is one of the most basic indicators, if it can even be called an indicator, yet it is poorly understood and often underutilized, which is a shame. Many traders and investors fixate on asset prices, chart patterns, and price-based indicators, but few pay much attention to volume. With this lesson, I hope to encourage you to focus more on volume and to better understand what you are seeing when you analyze it.
Unlike many exotic or complex indicators, virtually all charting platforms allow you to add trading volume to your charts. This includes free services like StockCharts.com and Finviz.com, as well as premium platforms like TradingView, which is what I use for the charts you see in this newsletter.
As shown in the example using gold futures below, volume is plotted beneath the asset’s price chart as a histogram and, depending on the type of asset, displays the number of shares (for stocks) or contracts (for futures) traded during a specific time period, whether that is 1 minute, 1 hour, 1 day, 1 week, 1 month, and so on.
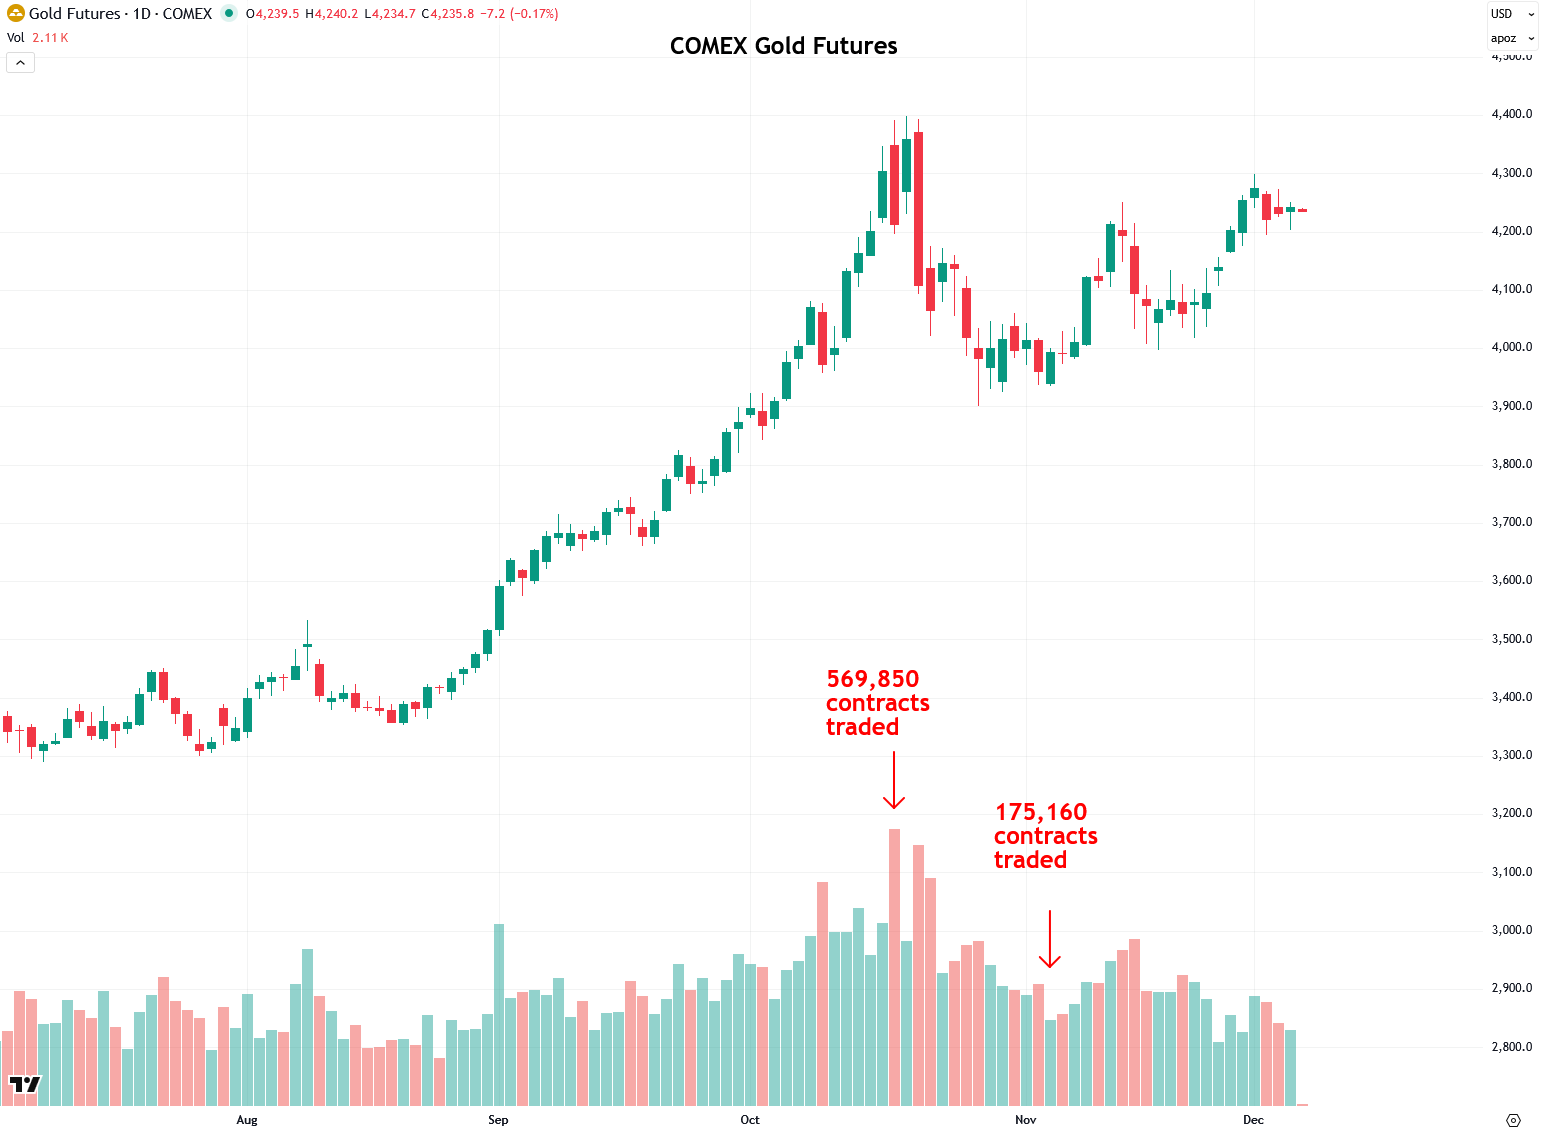
If the asset is up during a given time period, the volume bar is colored green, and the general assumption is that most of the volume represents buying. Conversely, if the asset is down during that time period, the volume bar is colored red, and the assumption is that most of the volume represents selling.
Volume is useful for confirming important moves because it lets you know if big institutions (the “smart money”) are behind it and getting in on the action. If you are interested in going long (i.e., buying), you want to see heavy volume during a bullish breakout and subsequent rally to confirm that there is real fuel behind it.
On the other hand, if there is a breakout or rally but volume is weak, that means there is little conviction behind it and that it is mostly retail traders (the “dumb money”) driving it and that institutions are not on board, likely because they know something, or even worse, because they are trying to engineer a false move to generate liquidity from retail traders so that they can bet in the opposite manner.
Now, that does not mean an asset can never rally successfully without heavy volume or that every breakout on heavy volume will succeed and lead to further gains. As with everything in the markets and in trading, it is about putting probability in your favor.
Breakouts on strong volume have a much higher probability of succeeding than breakouts on weak volume, and I will demonstrate that today with numerous examples from a wide variety of assets and markets. This is a universal principle that works for virtually every type of asset, including precious metals, commodities, stocks, ETFs, financial futures, currencies, cryptos, and bonds.
One point I want to make about volume in precious metals is that COMEX futures are the best place to monitor volume because that is where most price discovery occurs. The spot market, on the other hand, does not report volume, although charting services often show tick volume, which is a proxy for actual trading volume based on price changes (ticks) within a specific time period. It is often a decent approximation, but COMEX futures volume is much more accurate for analysis purposes like what we are doing today.
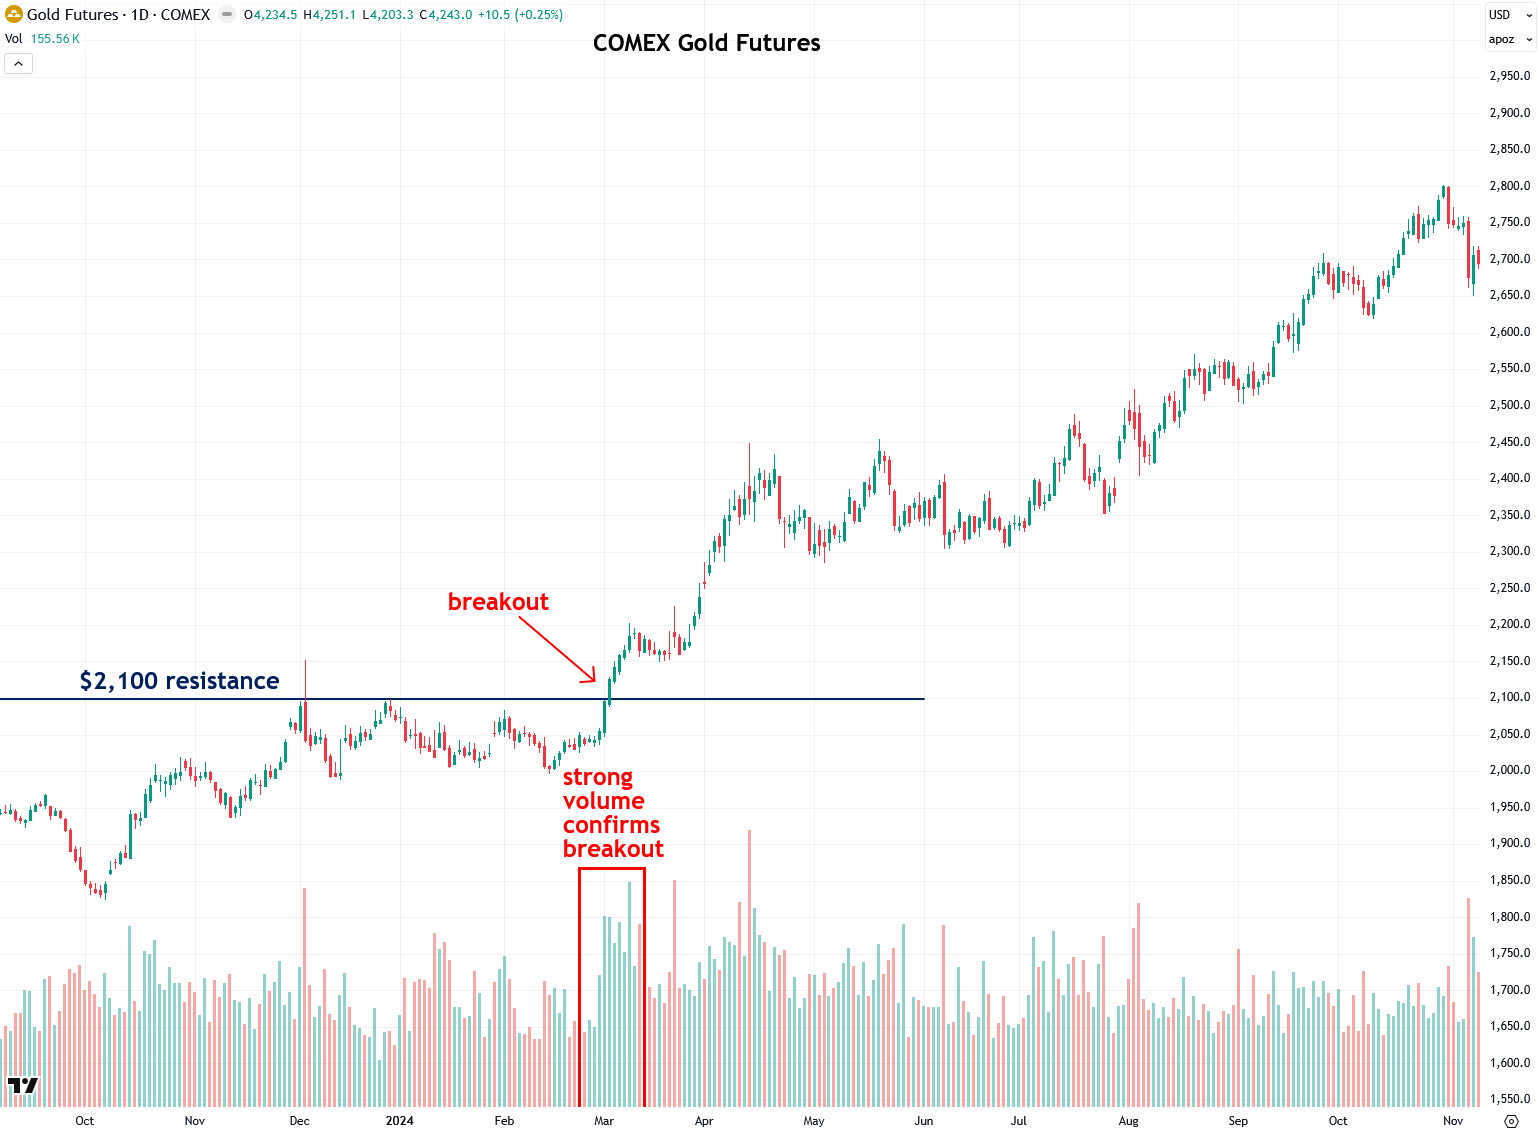
So let’s look at some examples of successful breakouts and how trading volume was used to confirm them, starting with COMEX gold futures in March 2024, which is the breakout that led to the powerful bull market gold is in now.
From 2020 until March 2024, gold had been capped under its $2,000 to $2,100 resistance zone, and many attempts to break above it failed. But it finally happened on March 1st, 2024, and I suspected it was about to happen and posted about it on Twitter/X just hours before it began.
COMEX gold surged above $2,100 and volume surged in confirmation, and not just for one day but for many days, which is even more ideal and meaningful than a single-day volume spike. That surge in volume meant that the smart money or institutions were jumping on board the rally, which greatly increased the probability of it working out, as it ultimately did.
Another beautiful example in gold came later in 2024, when a breakout from a triangle pattern that I wrote about led to a strong surge from $2,750 to $3,500 over the following few months. Notice how volume surged on the day of the breakout, confirming it.