
How to Know When the Precious Metals Pullback Is Over
The precious metals selloff may be close to running its course, according to a highly reliable methodology.

As you’ve likely heard, the inevitable pullback in precious metals continued today, with spot gold dropping 5.29% and spot silver falling 7.03%, marking the sharpest one-day decline in over a decade. That said, I’m not worried. This is simply a continuation of the temporary pullback and consolidation I discussed in Sunday’s update, and I recommend everyone give it another read in light of today’s action. I urge everyone to keep things in perspective, avoid panic, and stay focused on the very bright long-term outlook for precious metals. In today’s update, I’ll show you how to assess when this sell-off is likely to come to an end.
First, I want to highlight something notable on gold’s intraday chart over the past week. It formed a double top pattern exactly at the $4,400 level, which was the exact same price target I identified back on August 4th, before the $1,000 surge. Sure enough, gold hit that level on the nose, tested it a second time for confirmation, and then began to sell off starting Tuesday morning. The key point here is that the recent rally phase of the ongoing precious metals bull market had a pre-defined magnitude, which is why this pullback isn’t random or unexpected.
Next, I want to explore how to assess when the current pullback in precious metals and mining stocks has likely ended, and when they should stabilize and start recovering. To fully understand what I’m about to cover, I highly recommend revisiting my tutorial from one month ago, “When to Buy Dips and Sell Rips.”
To summarize, the core idea of that methodology is to trade with the trend, not against it. One of the most reliable ways to identify the trend is by observing the slope of the 200-day moving average (MA). If the 200-day MA is sloping upward, which is still the case across the precious metals space, the best approach is to embrace the uptrend and consider using pullbacks or oversold periods to add to your position. Oversold conditions within confirmed uptrends are typically short-lived, and the current pullback in precious metals fits that pattern well. That’s exactly what I’m going to show next.
The diagram below illustrates a confirmed uptrend based on the 200-day moving average, showing how oversold readings or dips are typically short-lived and typically followed by further gains:
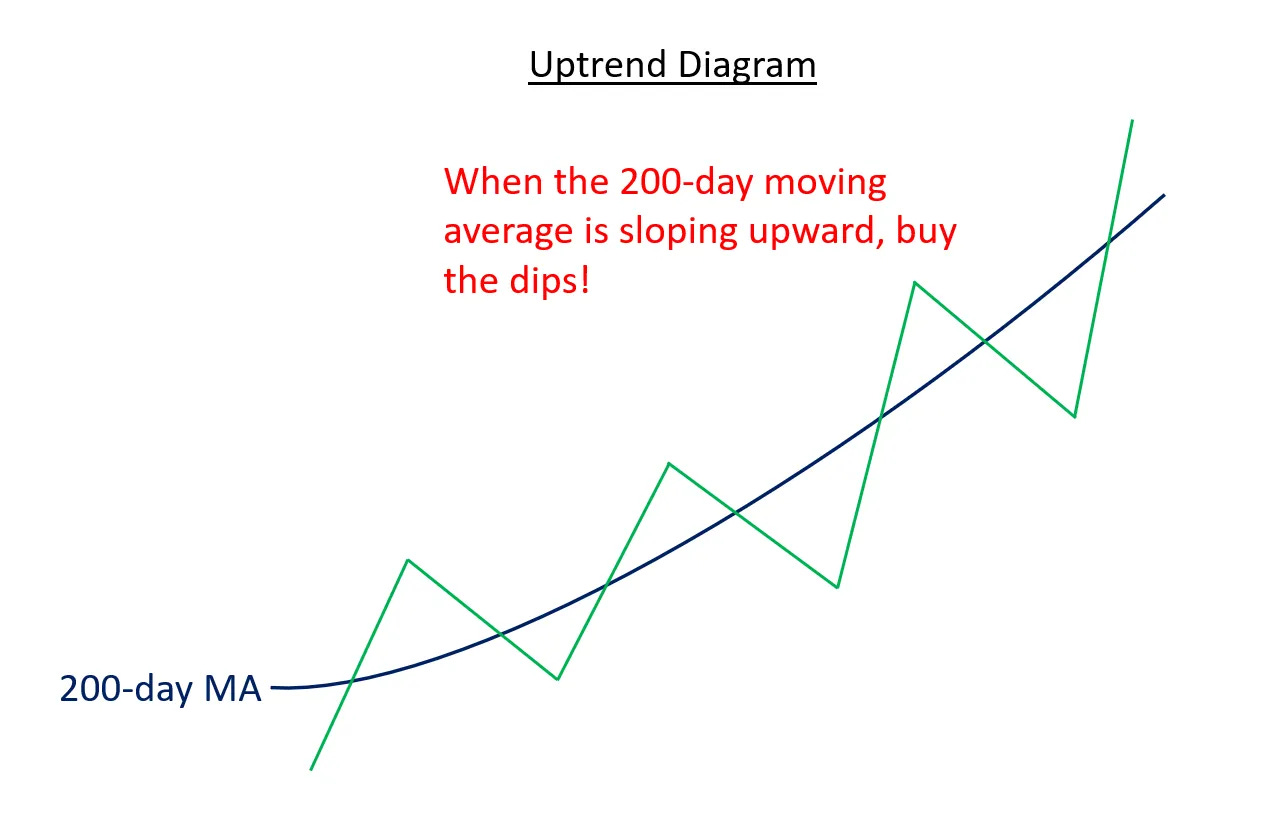
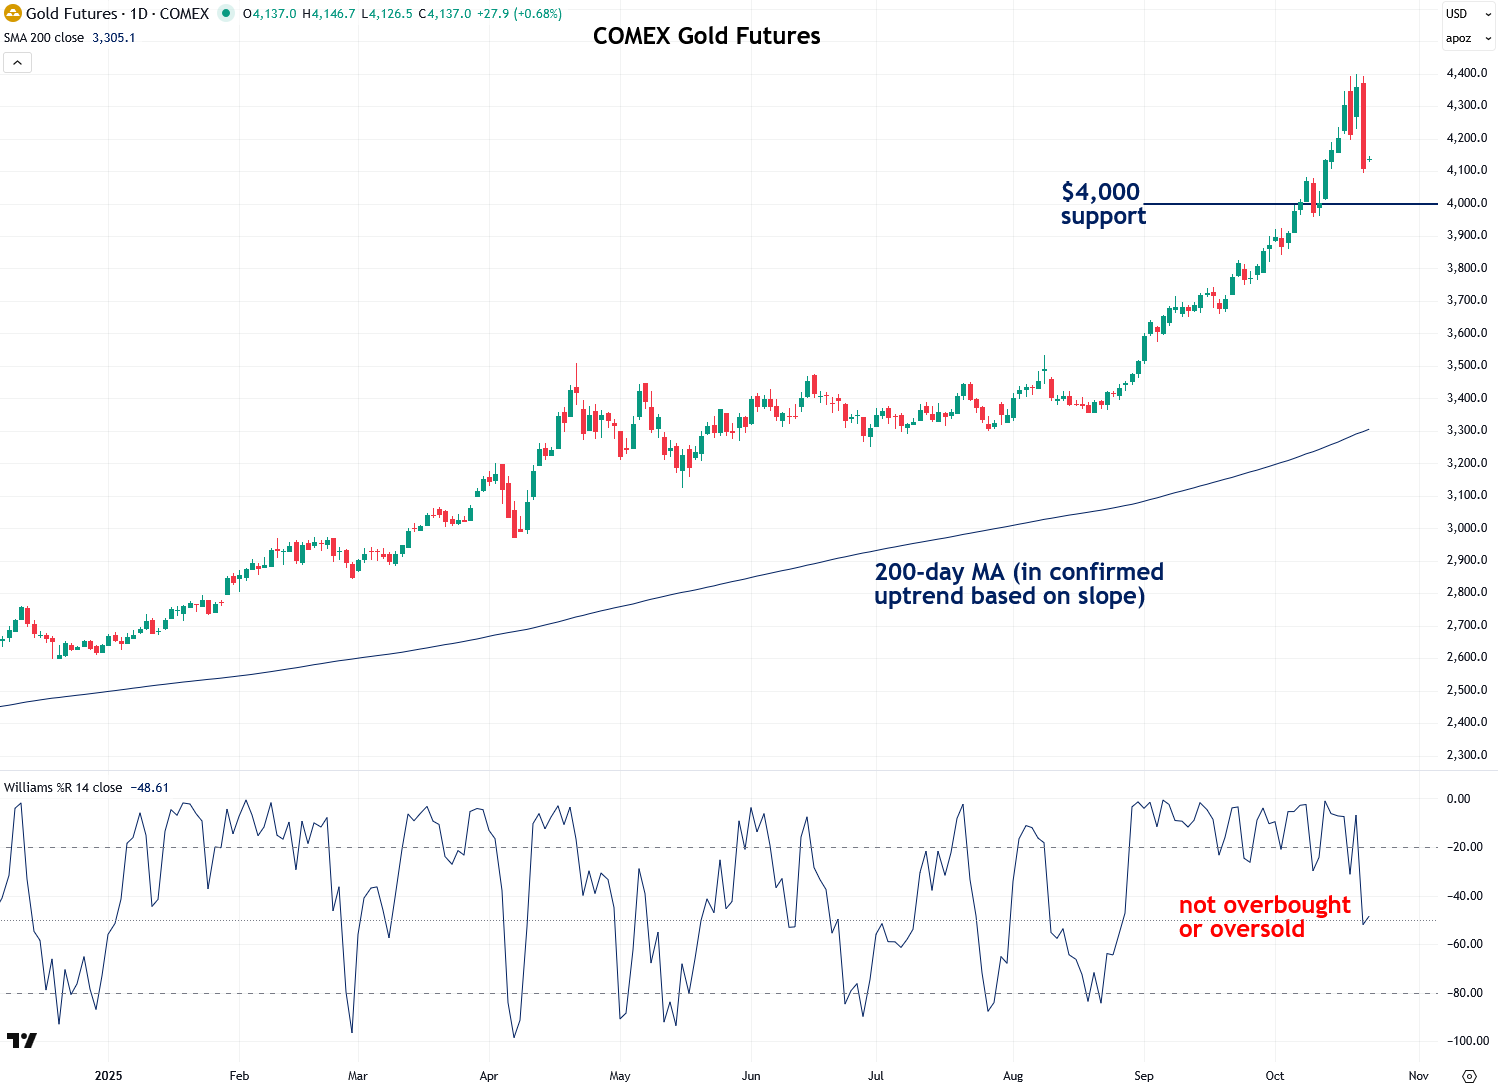
Now, armed with that knowledge, let’s take a look at where the precious metals arena stands, starting with gold. As you can see, its 200-day moving average is sloping clearly upward, which indicates that gold is in a confirmed uptrend. In this context, the wisest approach is to align with the trend and tune out negativity.
To assess when the pullback has likely run its course, I turn to one of my favorite tools: the Williams %R indicator. This is a momentum indicator that helps identify overbought and oversold conditions. I explained how I use it in detail in my tutorial on when to buy dips. Currently, as shown at the bottom of the chart, gold is no longer overbought as it had been since late August, which is a good sign.
What I’m looking for next is an oversold reading from %R. That would give me more confidence that the selloff has run its course and that gold is ready to continue in the direction of the primary trend once again, which is up. Also worth noting is the $4,000 level, which is likely the new floor for gold. Some further downside is possible as gold tests that support level, which would consequently trigger an oversold reading on %R. Assuming that occurs, I’ll feel much more confident saying the worst is over and that it’s time to shift focus back to the upside.
Like gold, silver is also in a confirmed uptrend based on the 200-day moving average. However, it has already nearly reached oversold levels on Williams %R, indicating that the selloff has largely run its course. Think of it as a quick flush: rip the Band-Aid off, clear out the overbought condition, and set silver up to continue its strong bull market, which is still in its early stages.