

In this report, I’m going to discuss my current thoughts on the energy sector and some interesting opportunities I am seeing to take advantage of what I expect will be a major energy supercycle in the years ahead. While I expect a powerful commodities supercycle over the next decade, including in energy, I have nevertheless been reluctant to get involved in energy investments since the U.S.-Iran war began due to the extreme geopolitical uncertainty and risk.
The erratic, on-again, off-again nature of peace deal discussions in recent months has caused wild gyrations in energy prices, making the sector virtually impossible to read. However, it is now becoming increasingly apparent that there will be no peace deal anytime soon, and I am seeing some very interesting setups in the energy sector, so I decided to write this report to share them with you.
That said, I must emphasize the extreme risk associated with this sector right now. These opportunities are highly speculative and headline-driven and are not necessarily straightforward buy-and-hold investments. However, those who are more comfortable taking risks, like myself, may find these ideas interesting, while those who are not can still learn from the analysis in this report.
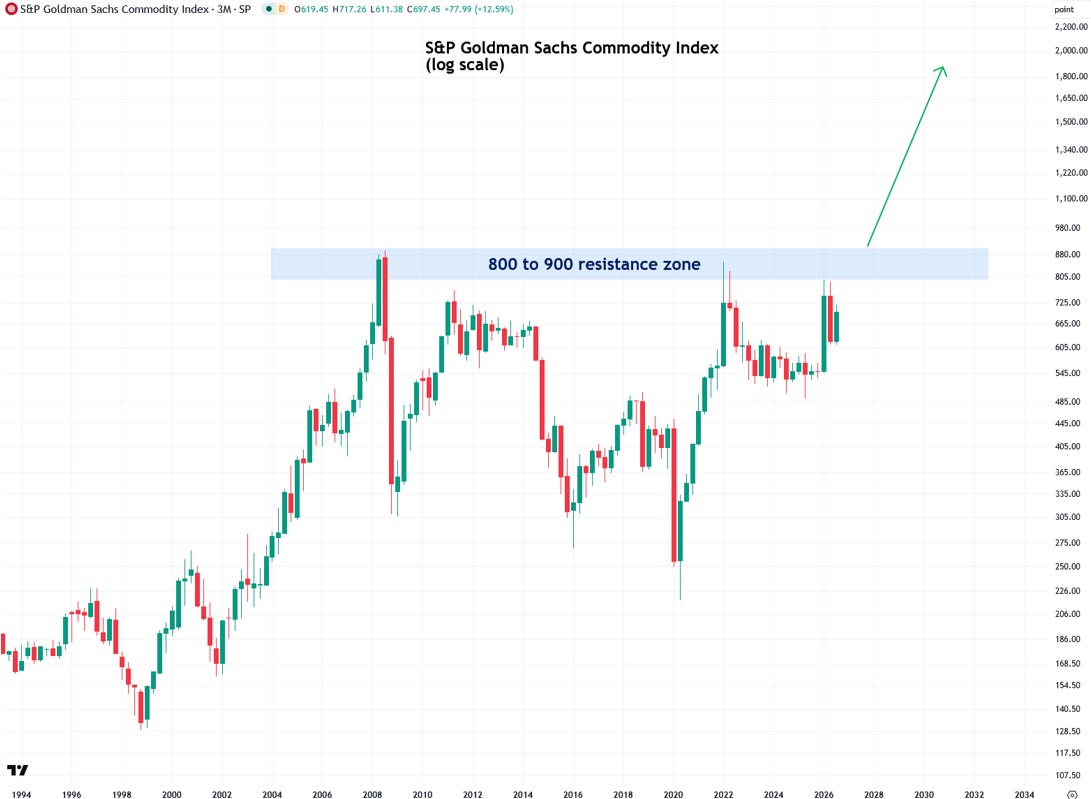
To start, I first want to show you the long-term chart of the GSCI Commodity Index, which can be thought of as the Dow or S&P 500 of commodity prices, over the past several decades. As the chart below shows, commodity prices have essentially treaded water since their 2008 peak, even as a tremendous amount of inflation has occurred during that time.
As a result, real, or inflation-adjusted, commodity prices have declined significantly and are now arguably the cheapest asset class in existence. I expect them to soon enter another powerful bull market, as I explained in detail in this report.
From a technical perspective, there is a clear resistance zone from 800 to 900 in the GSCI Commodity Index, formed by the major peaks in 2008, 2011, 2022, and early 2026. When the index finally breaks decisively above that resistance zone, which I believe will happen quite soon, I expect it to kick off another powerful commodities supercycle like those of the 1970s and 2000s.
To learn more about support and resistance zones, I recommend reading my two-part tutorial on the topic (Part 1 and Part 2).
I see this supercycle lasting at least a decade, as these cycles typically do, and driving prices dramatically higher across practically every commodity, including precious metals, industrial metals, energy, and agricultural commodities, as well as natural resources stocks. The result will be tremendous inflation that will be highly punishing to stocks and bonds.
While I’m bullish on commodities and natural resources across the board, this report focuses specifically on energy, so I next want to examine the technical setup in crude oil, starting with the U.S. benchmark, WTI, or light sweet crude oil. I will discuss the fundamentals shortly.
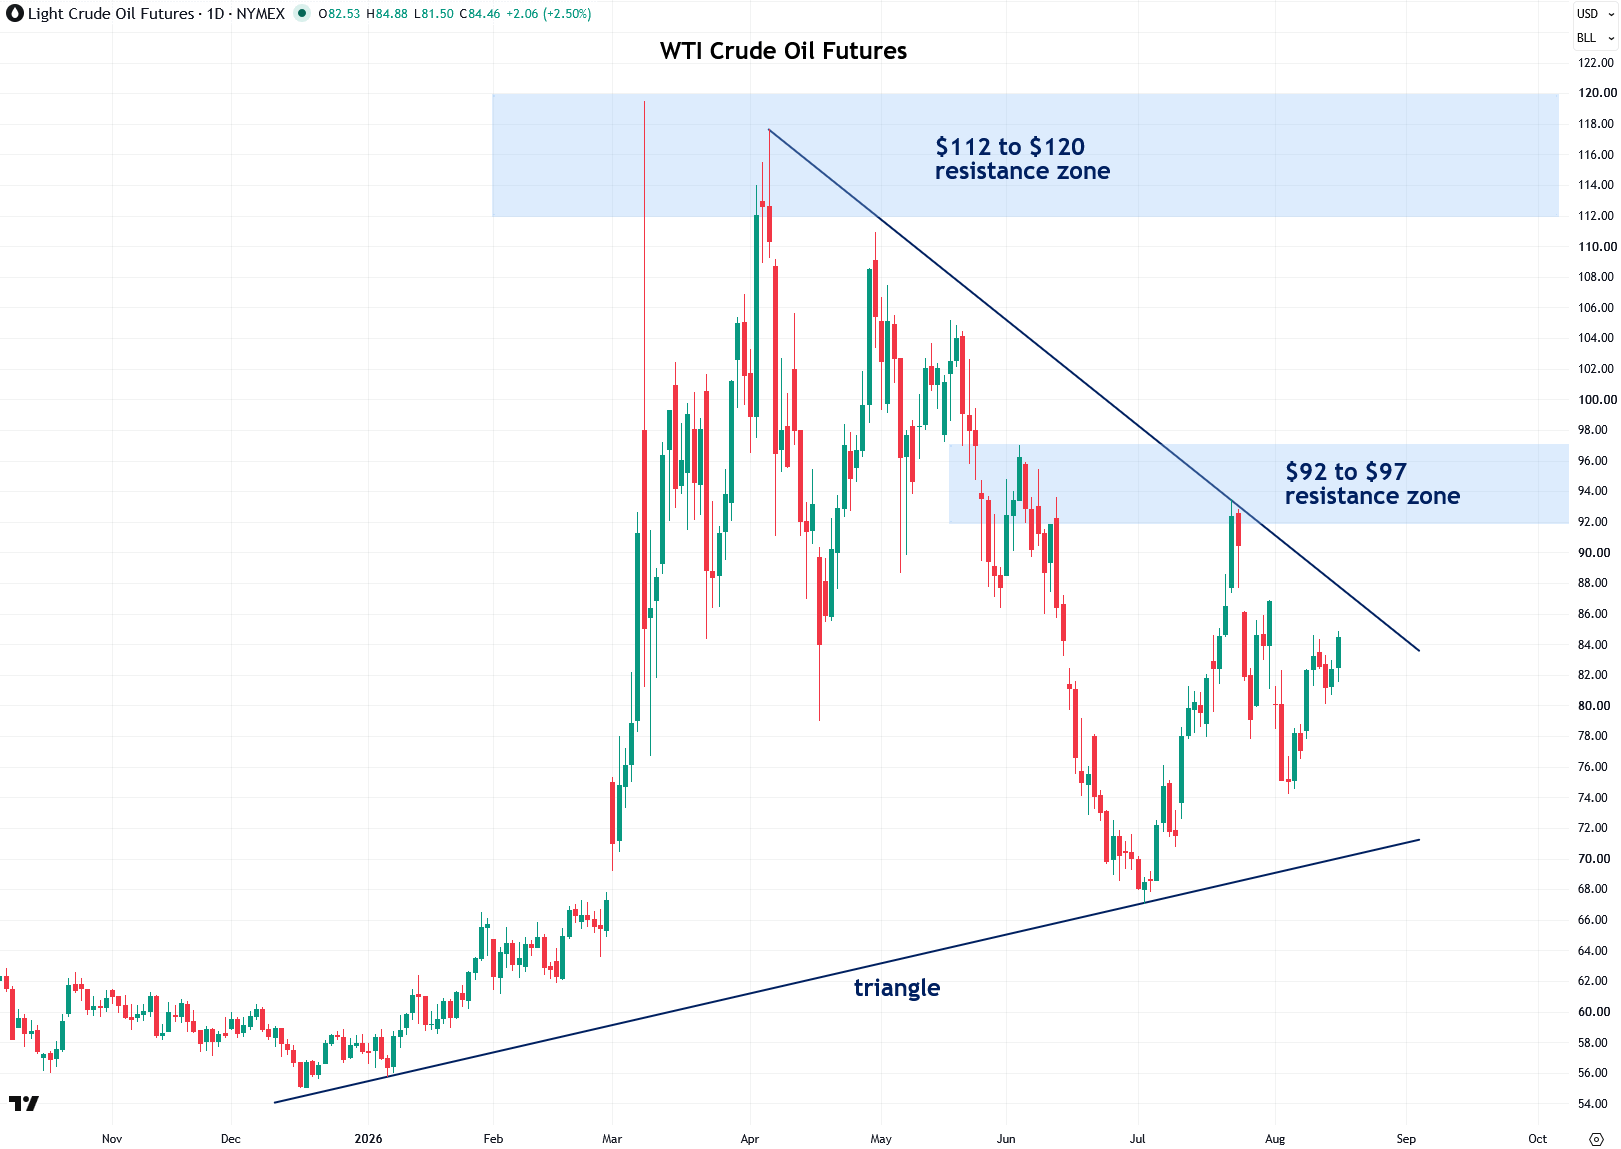
After the initial U.S.-Iran war-related surge in March that sent crude oil to nearly $120 per barrel, prices have since plunged from those highs due to optimism about, and promises from the U.S. government of, an imminent peace deal, heavy releases of oil from the U.S. Strategic Petroleum Reserve and other countries’ equivalent reserves, likely government efforts to suppress prices (as I’ll discuss in a bit), and demand destruction.
From a technical perspective, WTI crude oil has been forming a tightening triangle pattern over the past six months. These patterns often precede sharp moves once a breakout occurs and can be thought of as a compressed spring that ultimately releases with tremendous energy.
The scenario I am watching for is a decisive upside breakout from WTI crude oil’s triangle, potentially in conjunction with a serious negative turn in the Iran war, such as the United States and/or Israel dramatically escalating kinetic attacks against Iran or even launching a ground invasion, heaven forbid. Alternatively, the catalyst could simply be global oil inventories reaching dangerously low levels and crude oil subsequently repricing much higher.
Assuming a breakout from the triangle occurs, I would look for additional confirmation in the form of a breakout above the $92 to $97 resistance zone, followed ultimately by the $112 to $120 resistance zone formed by the major peaks in March and April. Breakouts above horizontal resistance zones are generally much more reliable than breakouts above diagonal resistance lines, such as the upper boundary of the triangle.
There are several different ways to play this potential scenario, assuming it occurs. The most straightforward would be through either full-size 1,000-barrel NYMEX crude oil futures or the smaller 100-barrel NYMEX crude oil futures. For those who do not trade futures or are not comfortable doing so, there is also the United States Oil Fund (USO), an oil-tracking ETF that can be purchased through any standard brokerage account, as well as the United States Gasoline Fund (UGA), though UGA is much more thinly traded and volatile than USO.
Again, I must emphasize that trading oil in any form right now is extremely speculative and high-risk, with prices highly sensitive to both bullish and bearish headlines, including developments that can occur overnight or over the weekend when you may be unable to trade or cut your losses. This is not for beginners, mom-and-pop investors, or anyone uncomfortable with substantial risk and volatility. I am certainly not advocating that anyone trade this setup, but simply sharing ideas for those who are more experienced with trading and understand the risks involved.
The way I would approach this oil triangle breakout setup is by scaling into my intended position in stages: first upon a high-volume breakout (learn more) above the triangle pattern, then adding to the position upon a breakout above the $92 to $97 resistance zone, and finally scaling in further upon a breakout above the $112 to $120 resistance zone. I would also use a stop-loss order placed a few percent below my initial entry price.
You can track WTI crude oil prices on Finviz.com.
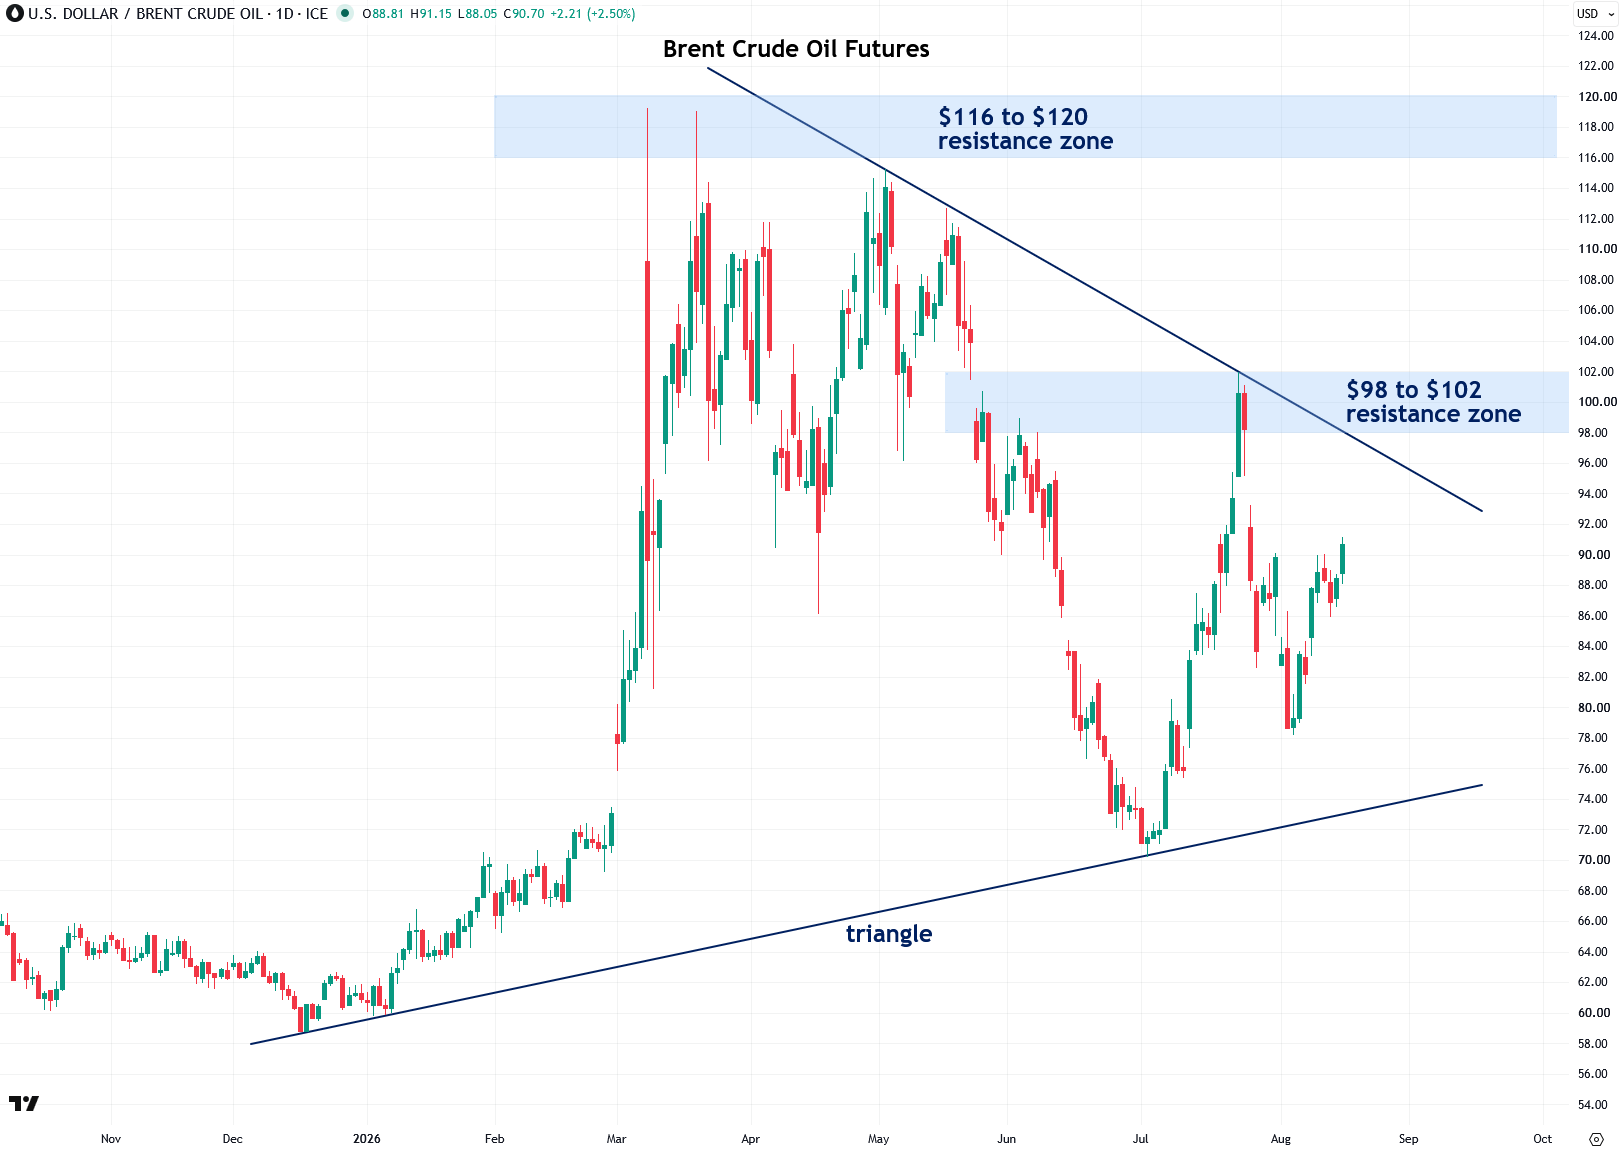
Next, let’s look at the setup in Brent crude oil, which is the global oil benchmark. Like WTI crude oil, Brent has also been forming a tightening triangle pattern over the past six months as it compresses ahead of a potentially powerful breakout.
My playbook for Brent crude oil is similar to that for WTI: I’m looking for an initial breakout from the triangle pattern, followed by breakouts above the $98 to $102 resistance zone and then the $116 to $120 resistance zone formed by the major peaks from March through May. Each successive breakout would provide an opportunity to scale further into the position.
As far as how to play this potential breakout, Brent-related financial products are less common and generally more thinly traded in the United States, so it is easier to simply use the WTI crude oil futures or USO ETF I mentioned previously. That said, there are also ICE-traded Brent crude oil futures, as well as the United States Brent Oil Fund (BNO) ETF, which can be purchased through any standard brokerage account.
You can track Brent crude oil prices on Finviz.com.
Regarding potential catalysts that could trigger another surge in oil prices, the most obvious is the recent breakdown in peace talks between the United States and Iran, with the 60-day MoU (Memorandum of Understanding) expiring today, Monday, August 17.
Both the Trump administration and Iranian leadership remain unwilling to reengage in peace talks, while Iran has become increasingly defiant and is now operating under a new doctrine of not merely remaining on the defensive, but increasingly going on the offensive against U.S. interests and proxies around the world.
Several recent Iranian statements reposted by The Hormuz Letter on X encapsulate the country’s current sentiment and stance:

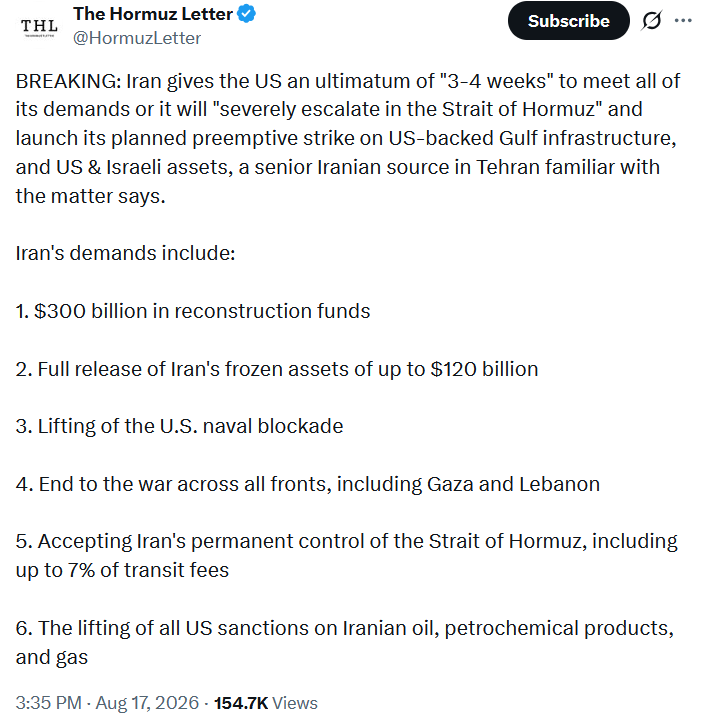
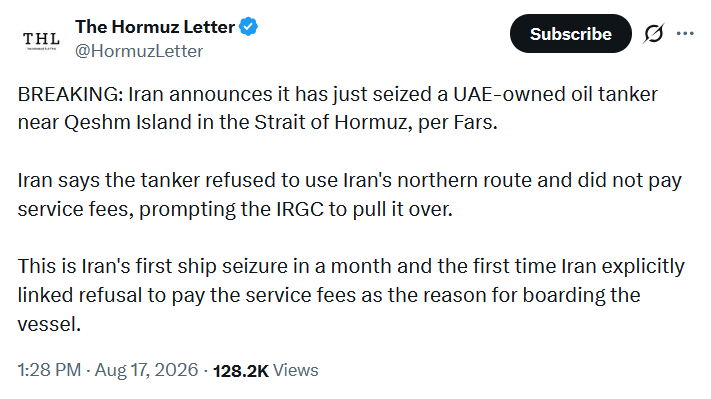
Given this sharp turn toward defiance and Iran’s rejection of peace efforts, I and other observers are wondering whether there will be another phase of kinetic attacks by the United States and/or Israel, or even a ground invasion, in addition to the unprecedented “economic isolation” plan that Treasury Secretary Scott Bessent has promised to announce sometime this week. There is even talk of potentially using nuclear weapons against Iran, which is terrifying and surreal if true.
Such an escalation, if it were to occur, would certainly serve as a catalyst for oil to resume its surge. Of course, this remains in the realm of speculation and geopolitical gambling, which is not something I typically like to engage in, as my bullish case for oil is based on the coming commodities supercycle. Nevertheless, we also have to play the hand we are dealt.
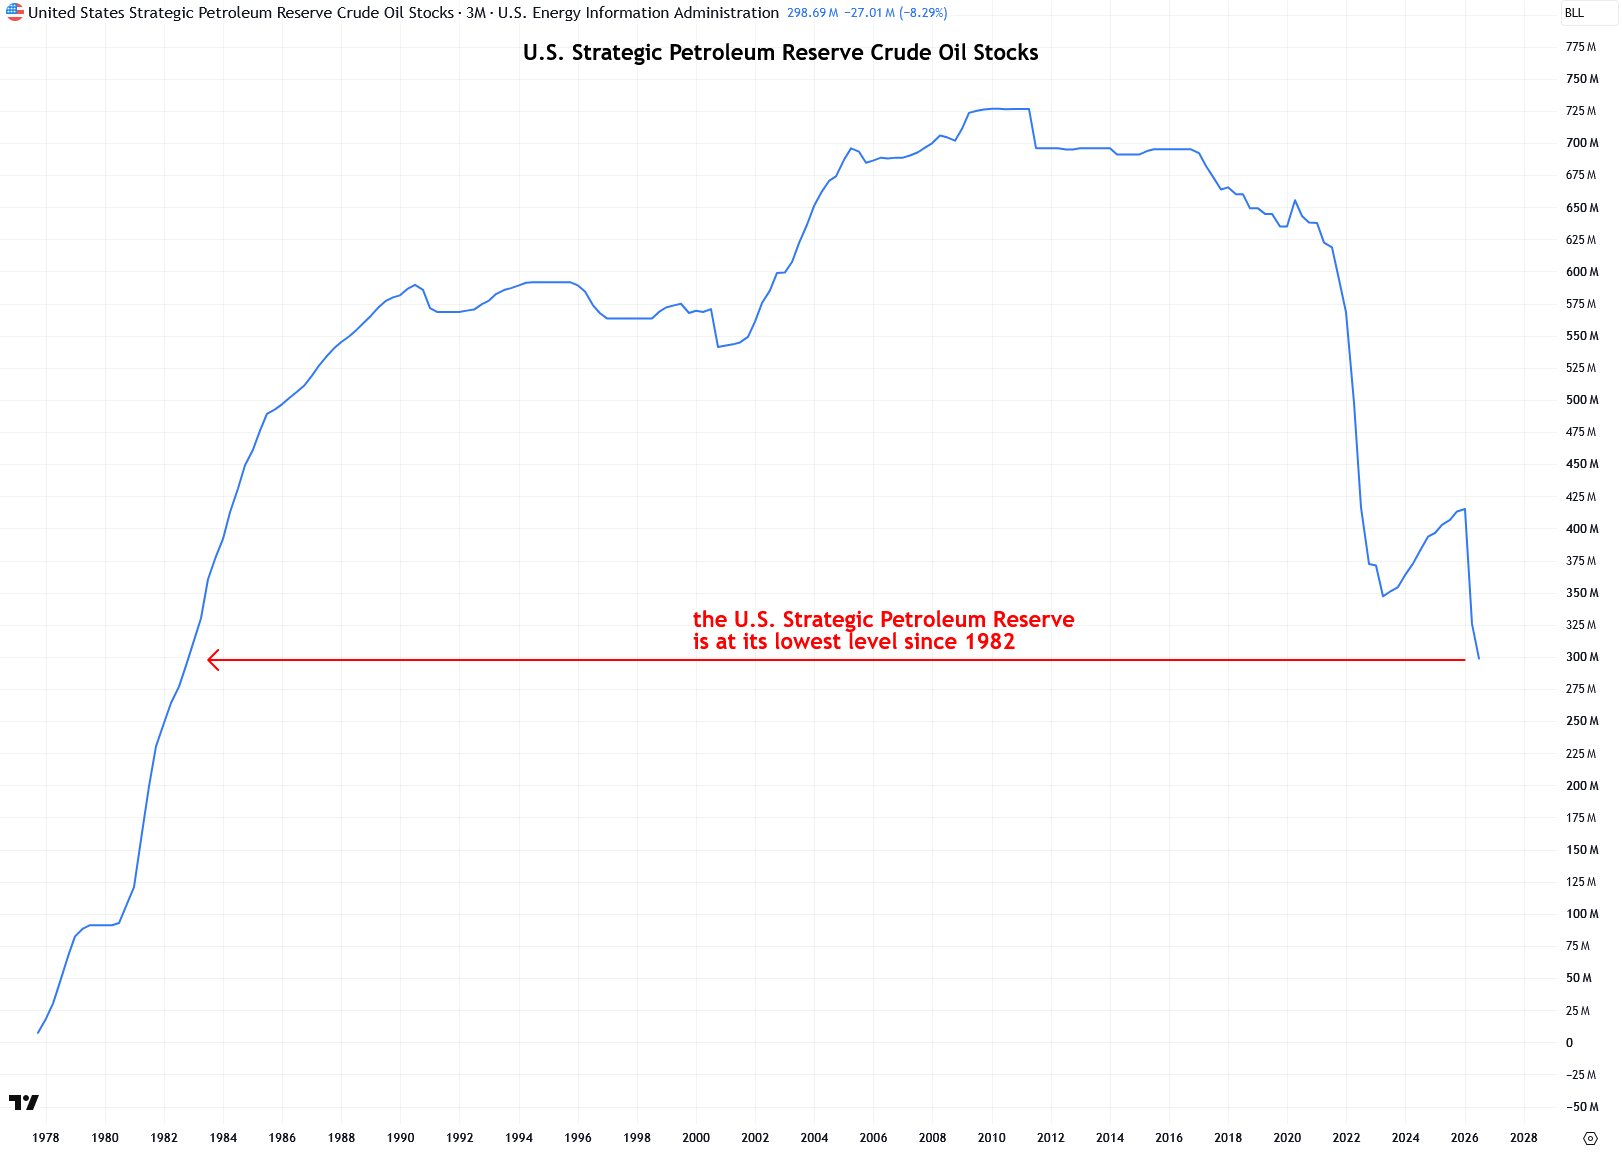
Even barring an escalation in the Iran conflict, another major potential bullish catalyst is that global oil inventories are reaching dangerously low levels, including the U.S. Strategic Petroleum Reserve (SPR), which just fell below 300 million barrels for the first time since 1982, with further drawdowns threatening to damage its underground salt caverns.
The release of these reserves since the war began is a major reason why oil prices are not even higher than they are today, but there is a limit to how much further they can be drawn down. The eventual need to rebuild these reserves should provide a major tailwind for oil prices in the years ahead.
Another important factor that held global oil prices down in the spring was China slashing its oil imports to a decade low while drawing from its substantial stockpile of roughly 1.397 billion barrels. However, a recent report showed that China’s oil imports rebounded a significant 22% in July from the previous month, and if that trend continues, it should provide another source of upward pressure on oil prices.
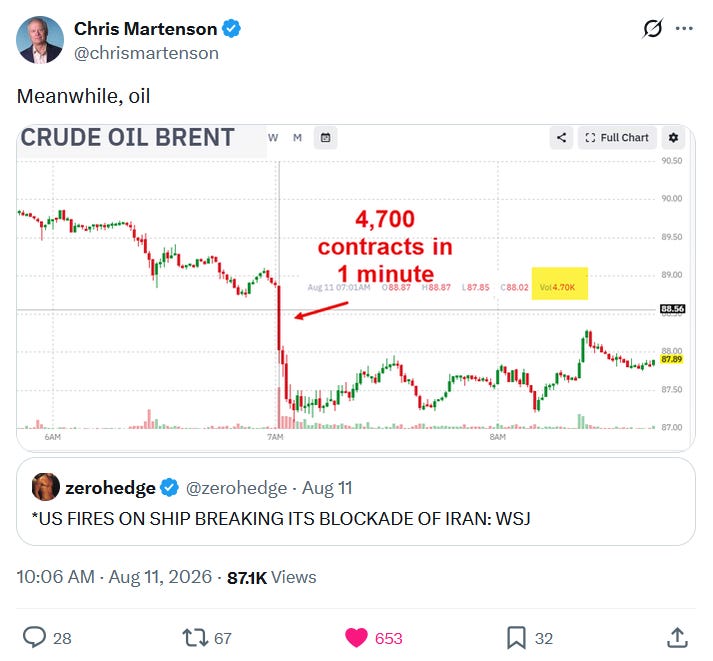
There is also credible reason to believe that oil prices have been suppressed in recent months through massive selling of naked “paper” oil in the futures market, by the U.S. government and possibly Japan. Much of this selling occurs very early in the morning, when trading is thinnest and large orders have the greatest potential to push prices lower.
Such disruptive trading is difficult to rationalize as normal hedging or trading activity, since market participants typically seek the most liquid trading hours precisely to minimize their impact on price.
Chris Martenson has been pounding the table about this likely downward manipulation of oil prices, and I’m inclined to agree with him, especially given the many parallels I see with the suppression of precious metals prices:
Of course, I want to emphasize that while commodity price manipulation can be effective in the short term, it ultimately cannot overpower the forces of economics and supply and demand. Suppressing oil prices is like holding a basketball underwater: you can keep it submerged for a while, but eventually it will break free and surge toward its natural level. That moment may come with a decisive breakout from the oil triangle patterns I showed earlier.
On that note, I now want to show several long-term charts of crude oil, including various forms of inflation adjustment, to demonstrate that while oil prices may appear relatively high in nominal terms, they are still quite low in real terms and therefore have substantial room to move higher if they are to revisit their historical inflation-adjusted peaks.
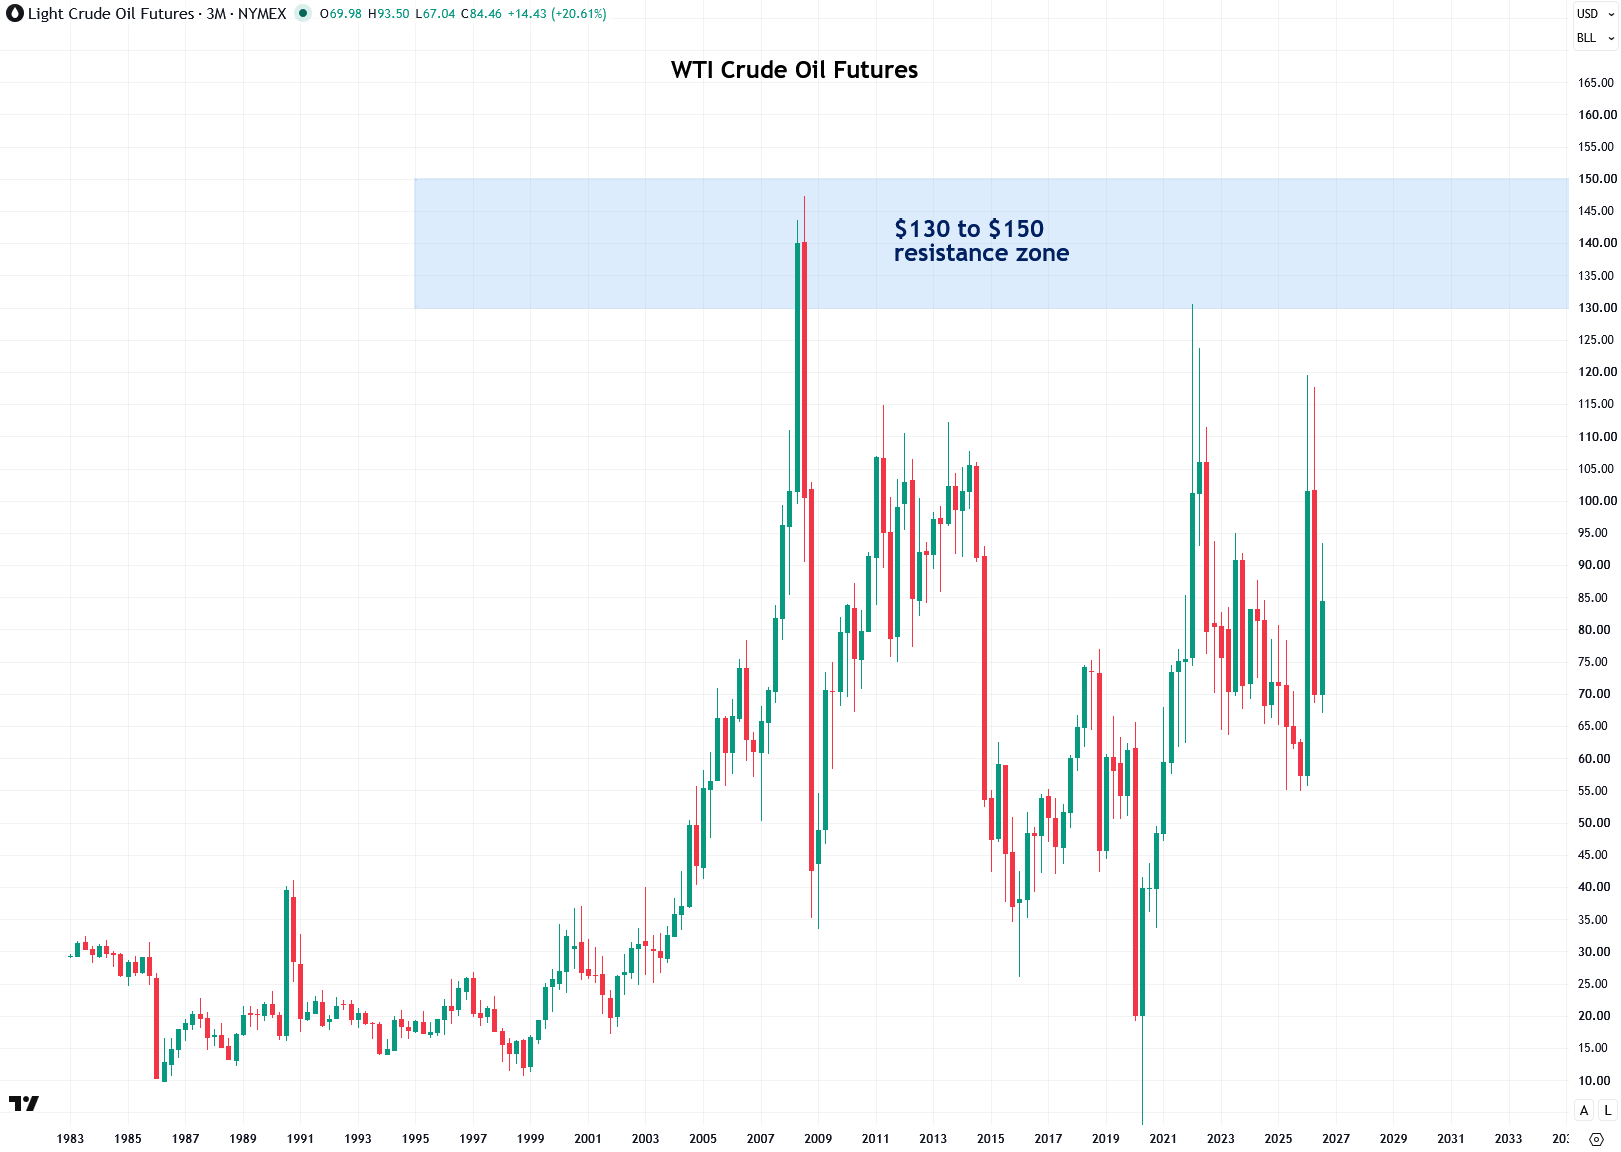
The chart below shows the nominal price of WTI crude oil going back to 1983. As you can see, oil peaked at $147.27 per barrel in 2008 and reached as high as $130.50 as recently as 2022, both far above its current price of $84.46, especially considering how much inflation has occurred over the past couple of decades.
From a technical perspective, there is a major resistance zone between $130 and $150, formed by the 2008 and 2022 peaks. If and when oil decisively breaks above that zone, prices of $200 per barrel and beyond are certainly possible over the course of the energy supercycle ahead. At a minimum, it is certainly not inconceivable for oil to surge toward that resistance zone in the near future if the U.S.-Iran war does not de-escalate soon.
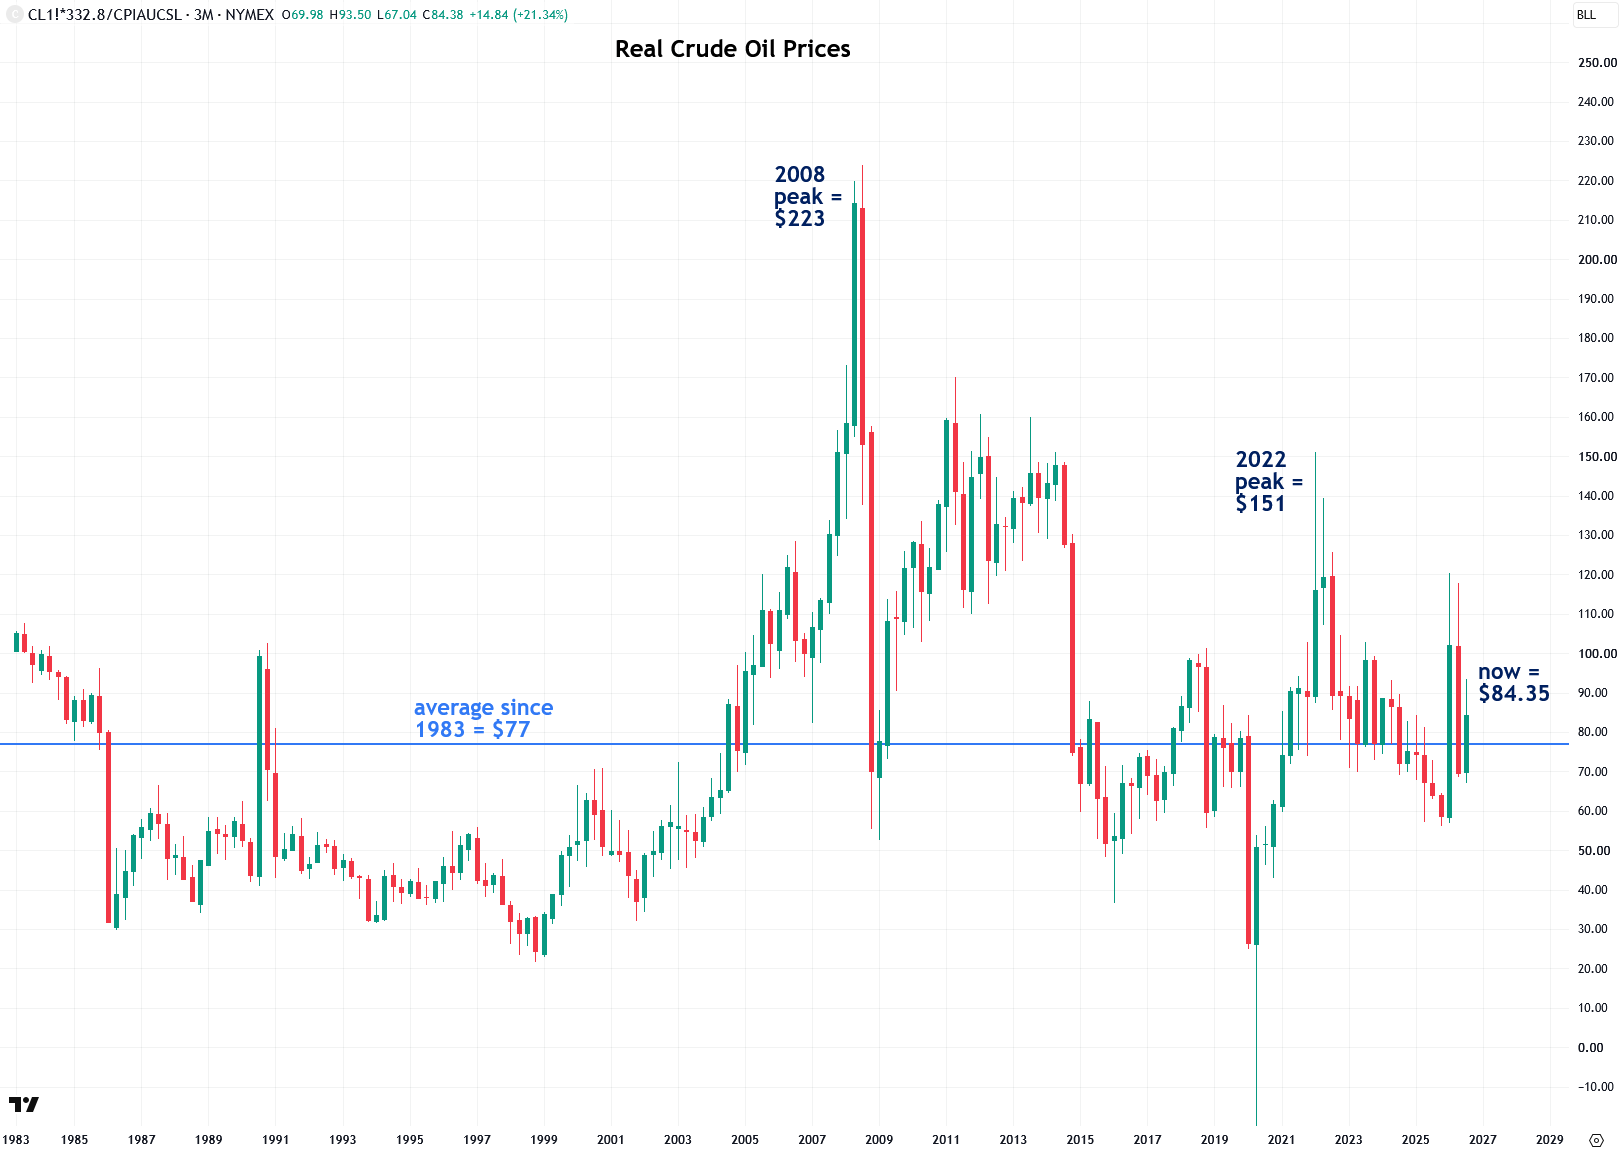
While the previous chart showed nominal oil prices, the chart below adjusts the price of oil for the U.S. Consumer Price Index (CPI). It shows that the average real price of oil over the past four decades was roughly $77 in 2026 dollars, while the 2008 peak reached $223 and the 2022 peak reached $151.
That puts today’s price of just $84.35 into perspective, as it is only slightly above the long-term inflation-adjusted average and shows just how much room oil has to surge in the event of a serious escalation in the war and/or during the energy supercycle ahead.
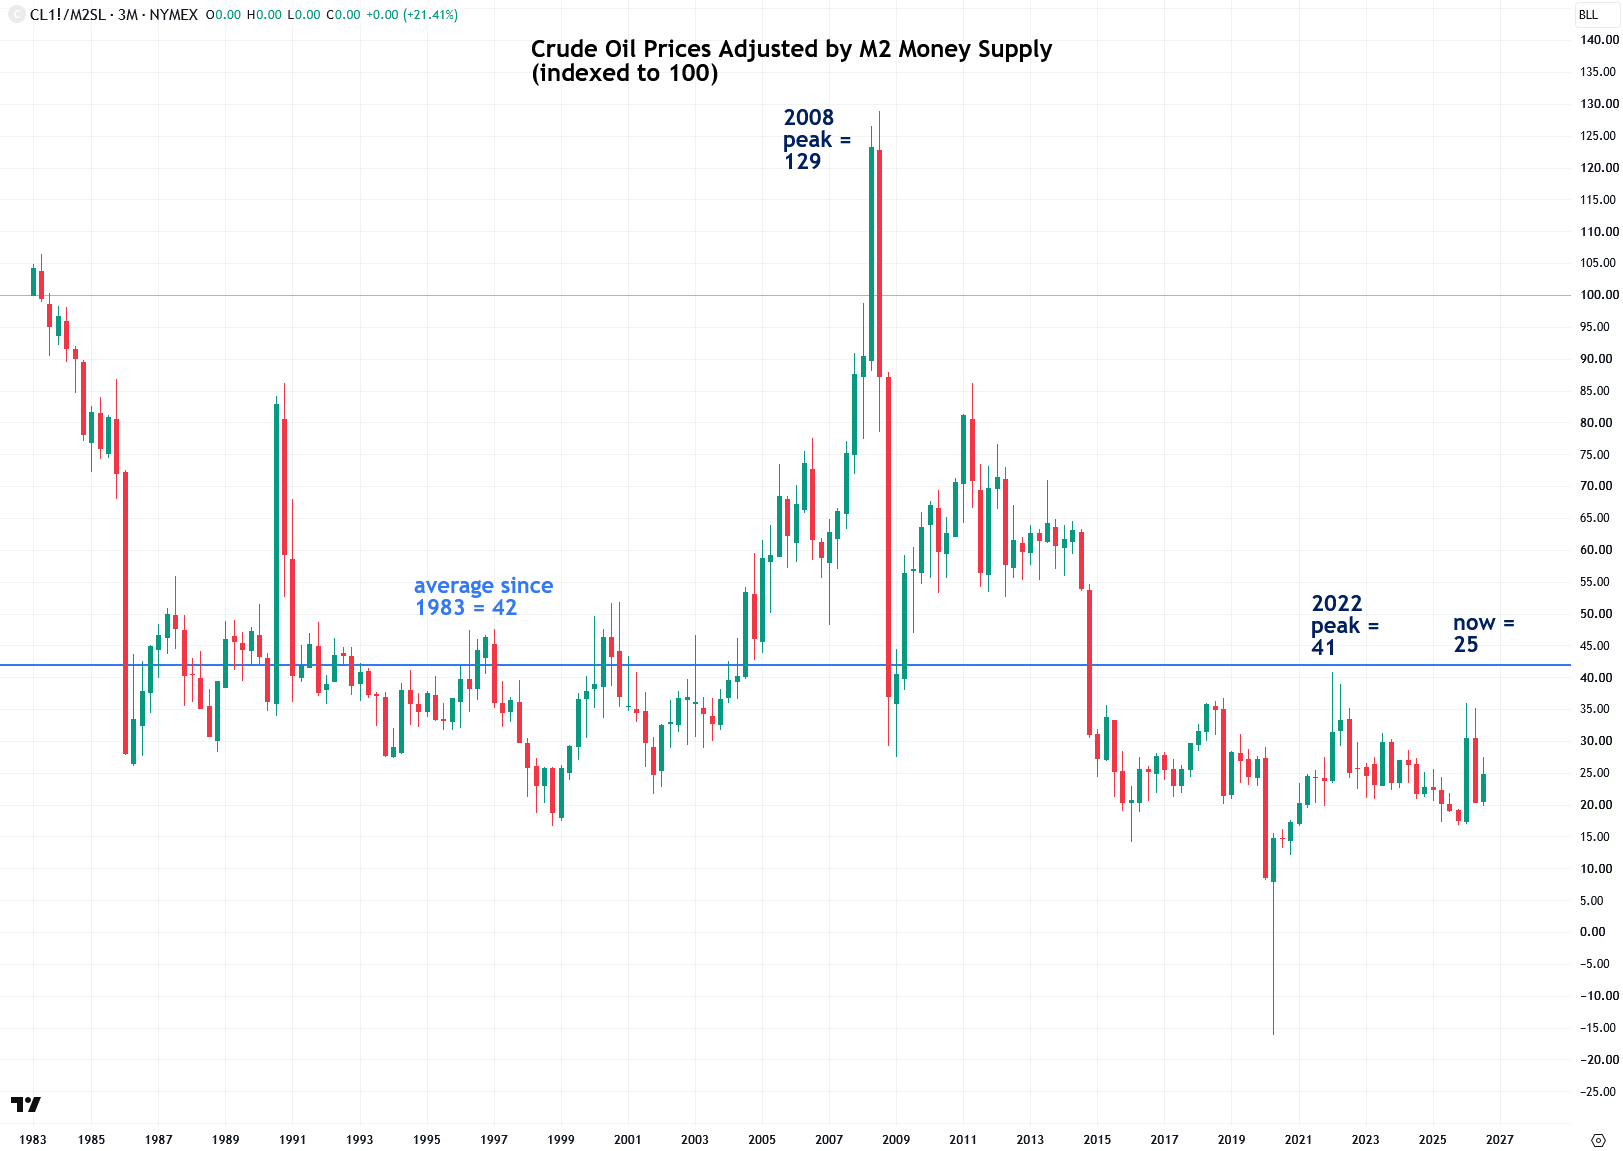
Adjusting prices for inflation using the CPI is standard practice in the world of economics and finance, but there is good reason to believe that the CPI understates the true rate of inflation. For that reason, I prefer to adjust prices using the U.S. M2 money supply, which I find to be a more accurate way of accounting for monetary inflation.
The long-term chart of crude oil prices adjusted by the M2 money supply, and indexed to 100 for easier interpretation, shows an average of 42 since 1983, a peak of 129 in 2008, and a peak of 41 in 2022, compared with a reading of just 25 today. This implies that crude oil is actually trading well below its long-term average on an M2-adjusted basis and has substantial room to run if it is to revisit its historic peaks.
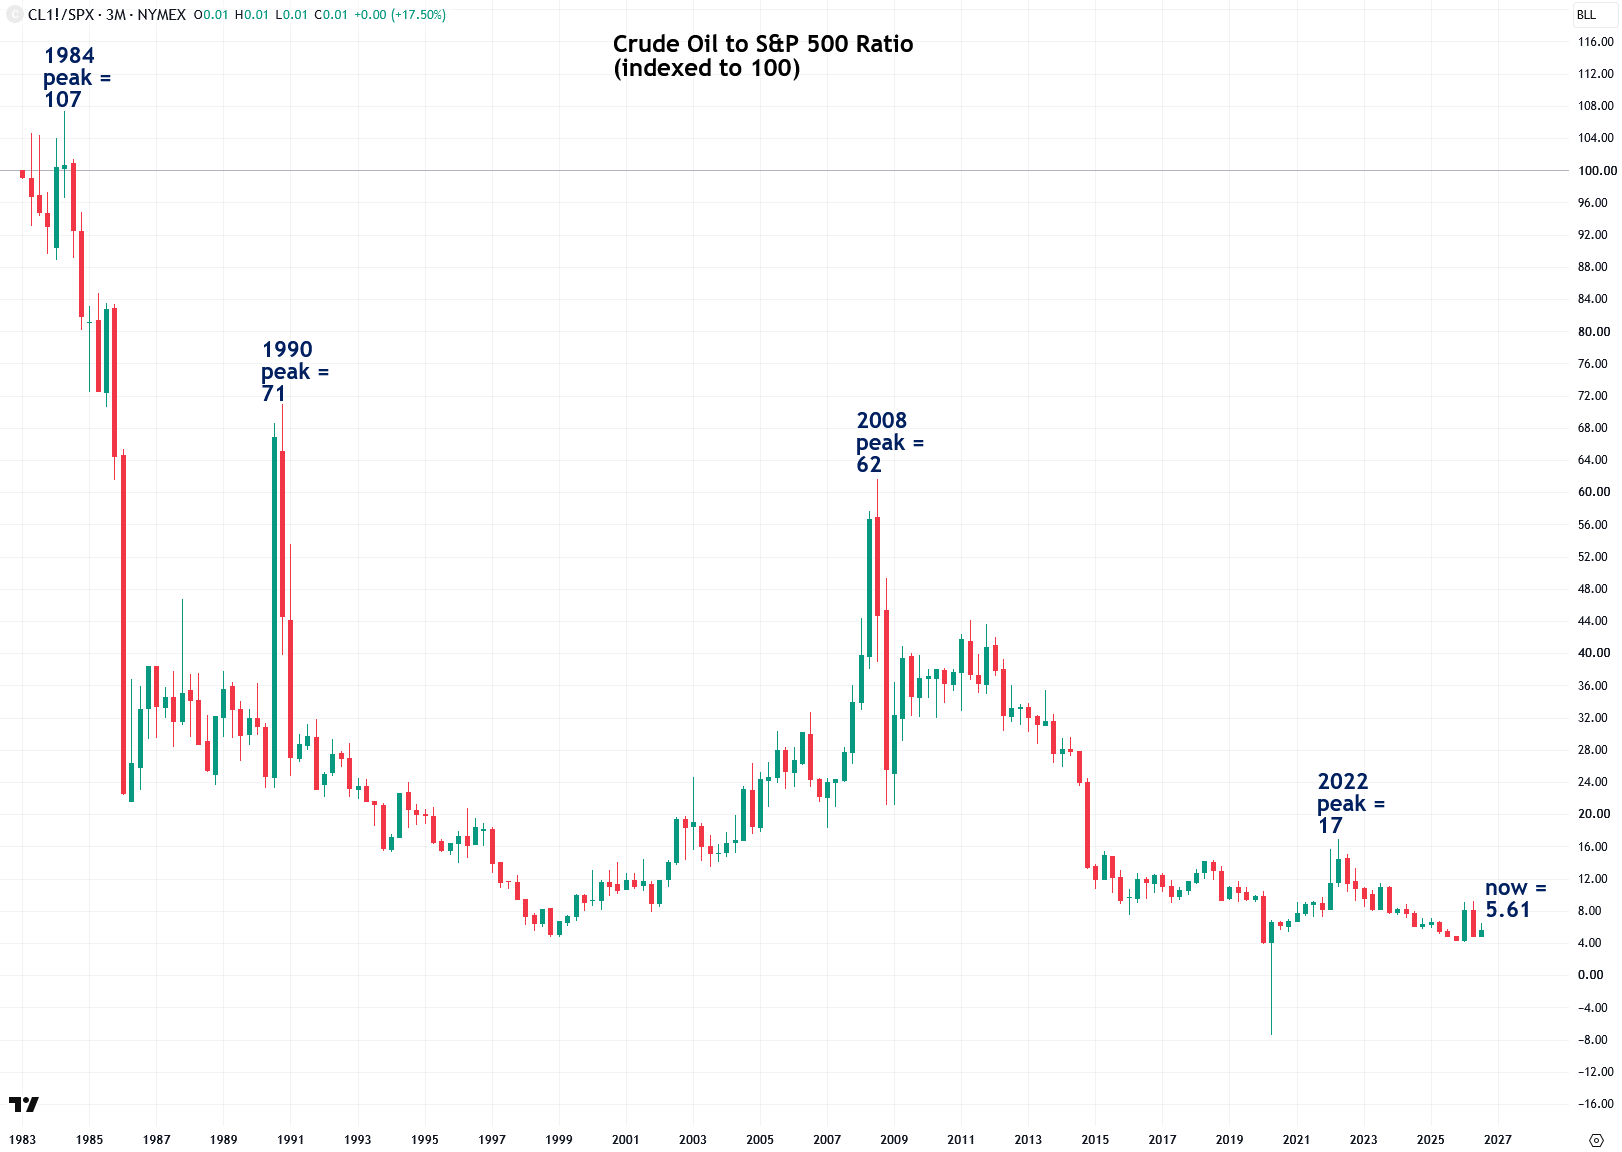
I am also fond of comparing commodity and precious metals prices to the S&P 500, which makes sense because commodities and stocks have historically acted as counterbalances to one another. When one is in a secular, or long-term, bull market, the other is typically in a secular bear market or period of stagnation, and vice versa, as capital rotates between the two in recurring cycles that typically last at least a decade, as I explained in this recent report.
The WTI crude oil-to-S&P 500 ratio, indexed to 100, is currently near record lows at just 5.61, compared with 107 at its 1984 peak, 71 at its 1990 Gulf War peak, 62 at its 2008 peak, and 17 at its 2022 peak. This extremely low price of crude oil relative to U.S. stocks reflects both the undervaluation of crude oil and the biggest stock market bubble in history, as I explained in my report linked above.
I firmly believe that the bursting of that stock market bubble will unleash tremendous amounts of capital that will flow into oil, precious metals, and other commodities, providing a huge source of fuel for the supercycle ahead.
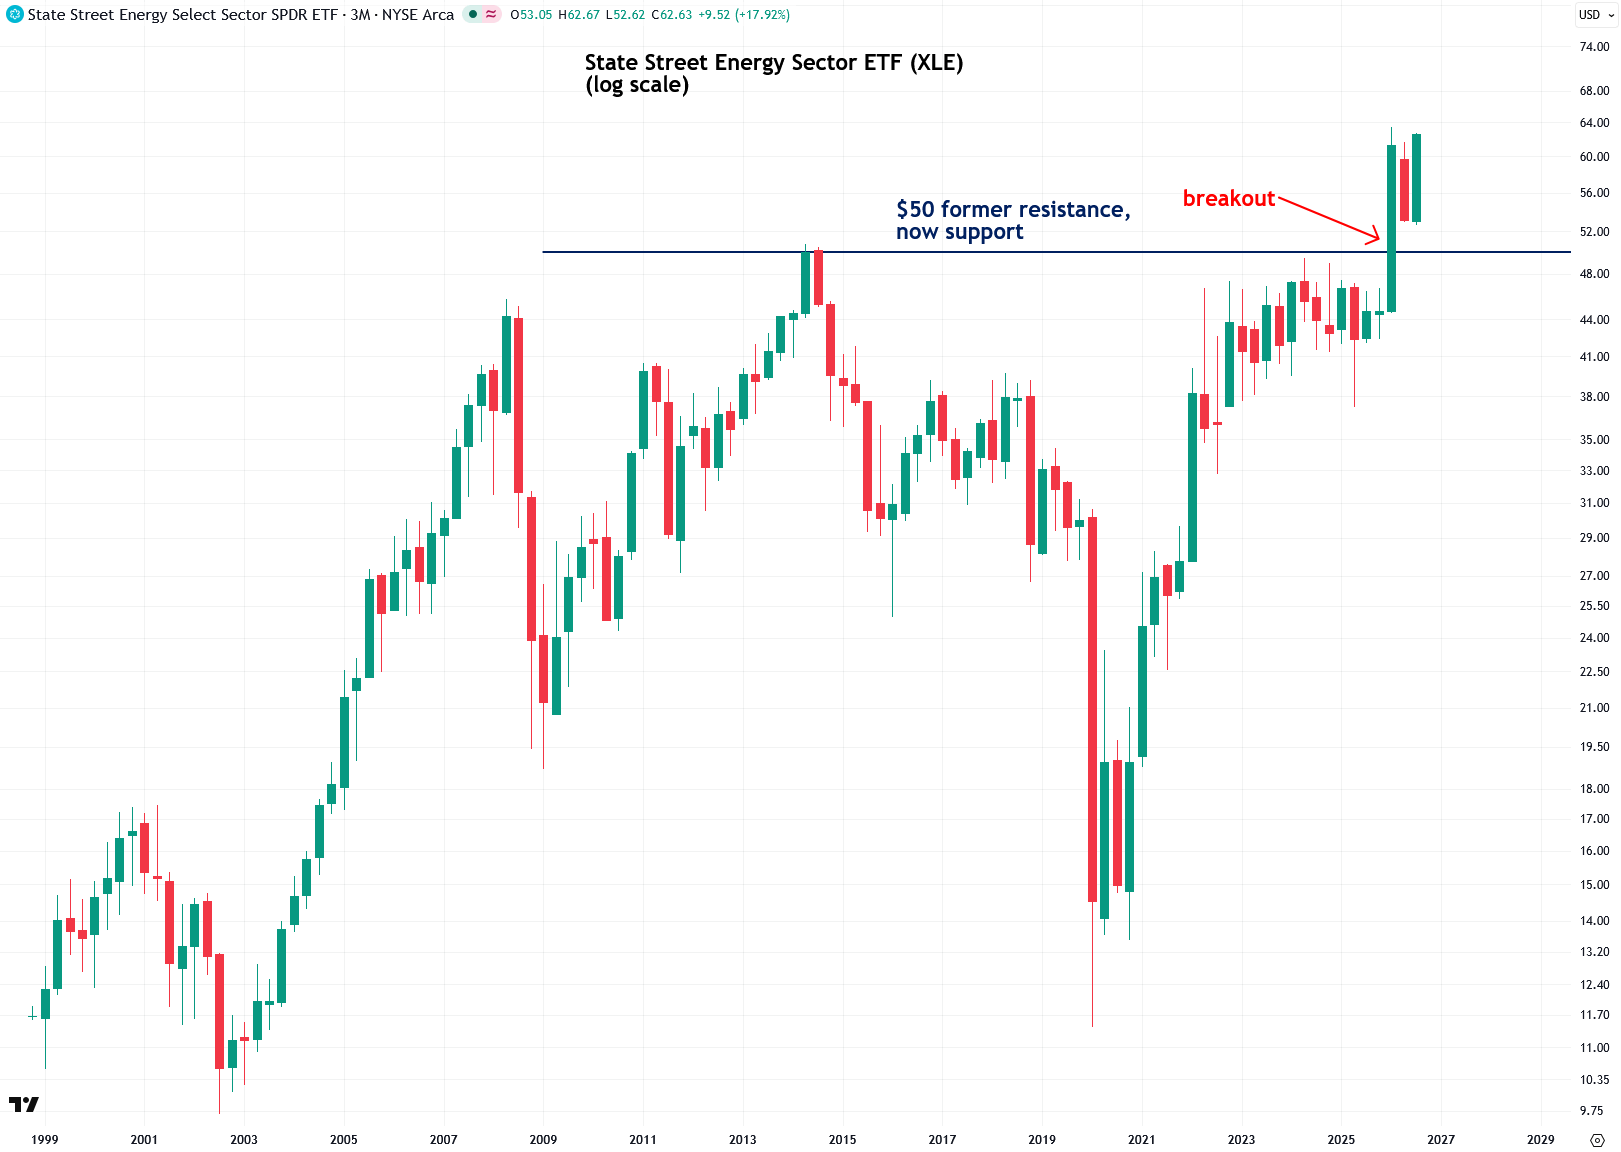
Next, let’s take a look at the long-term chart of energy stocks, as represented by the popular State Street Energy Sector ETF (XLE). A few months ago, XLE broke above the key $50 resistance level established by the major highs in 2014 and 2024.
I view this breakout as a sign that a new long-term bull market in the energy sector has begun, with much greater gains still ahead. I expect this run to ultimately match or even exceed the powerful energy bull market from 2002 to 2008.
The charting platform TrendSpider published a fascinating chart comparing XLE’s recent breakout with gold’s breakout in early 2024, implying that energy stocks may be following a similar trajectory and presenting another major opportunity:
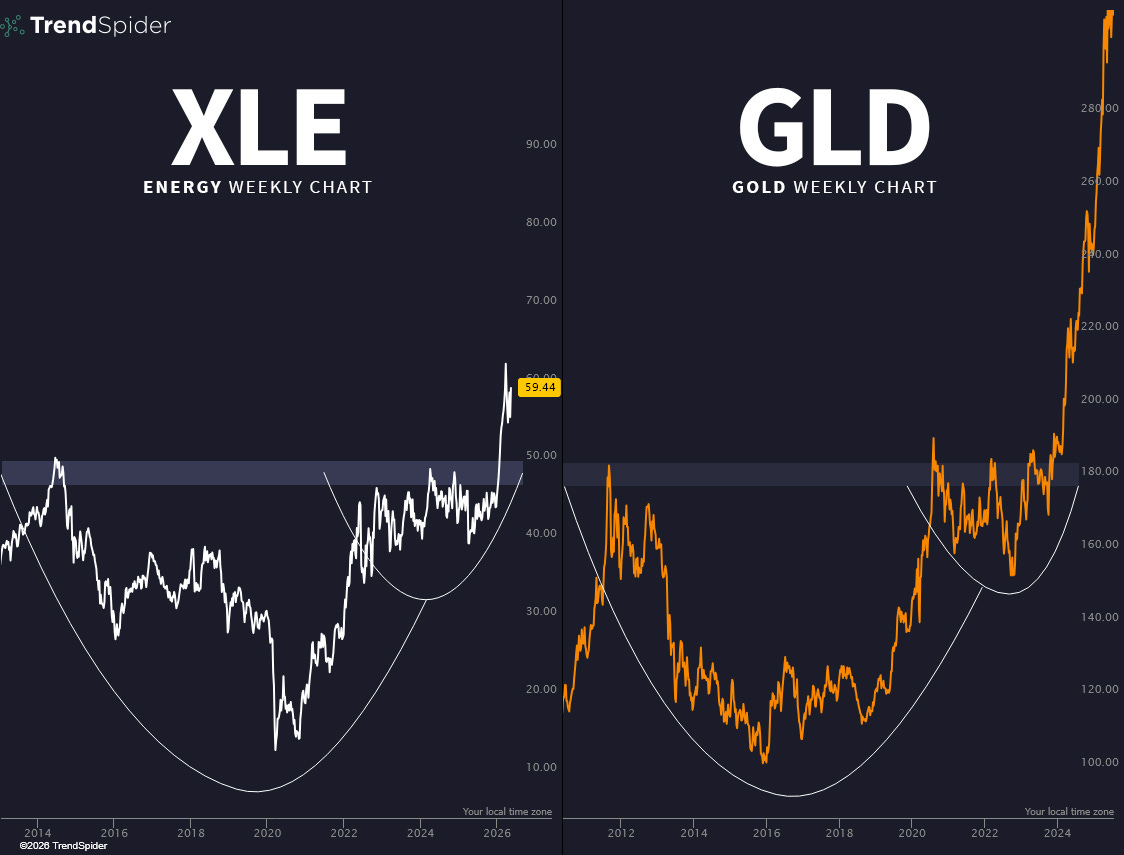
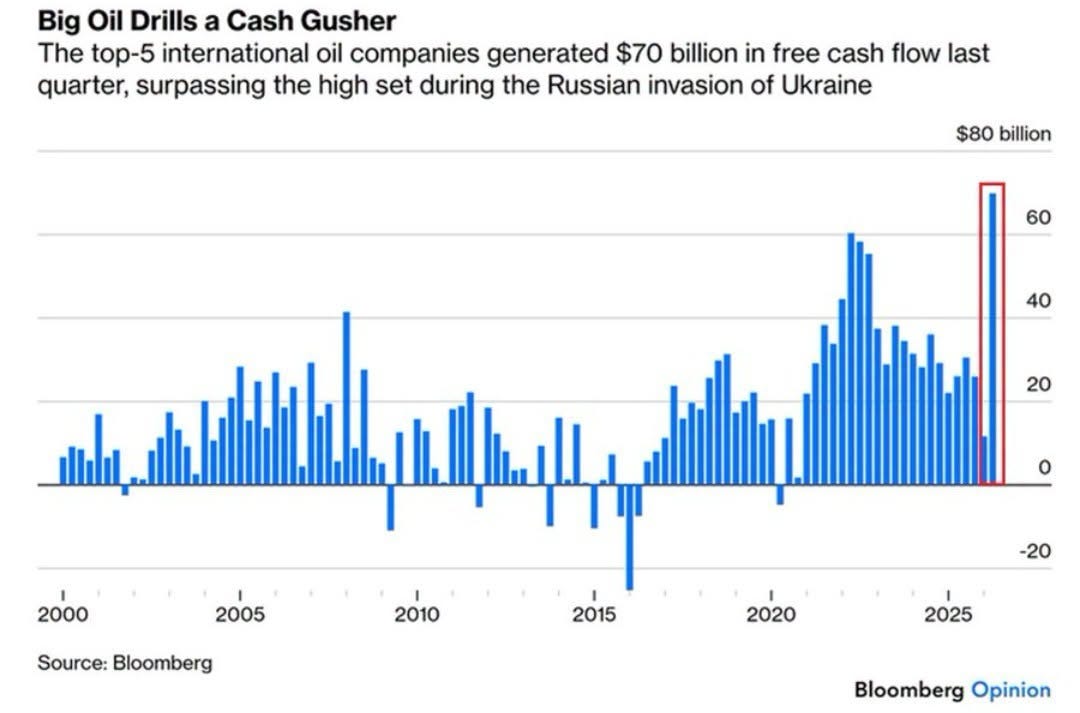
XLE is heavily weighted toward large integrated oil companies, with Exxon Mobil and Chevron together accounting for roughly 35% of its holdings. These companies have been minting money amid the Iran war-driven surge in oil prices, with the five largest international oil companies generating approximately $70 billion in free cash flow in Q2 2026, the highest amount on record according to Bloomberg.
Given this extraordinary profitability, and the potential for even greater profits if oil embarks on another leg higher, it is not hard to see why XLE could have much further to run.
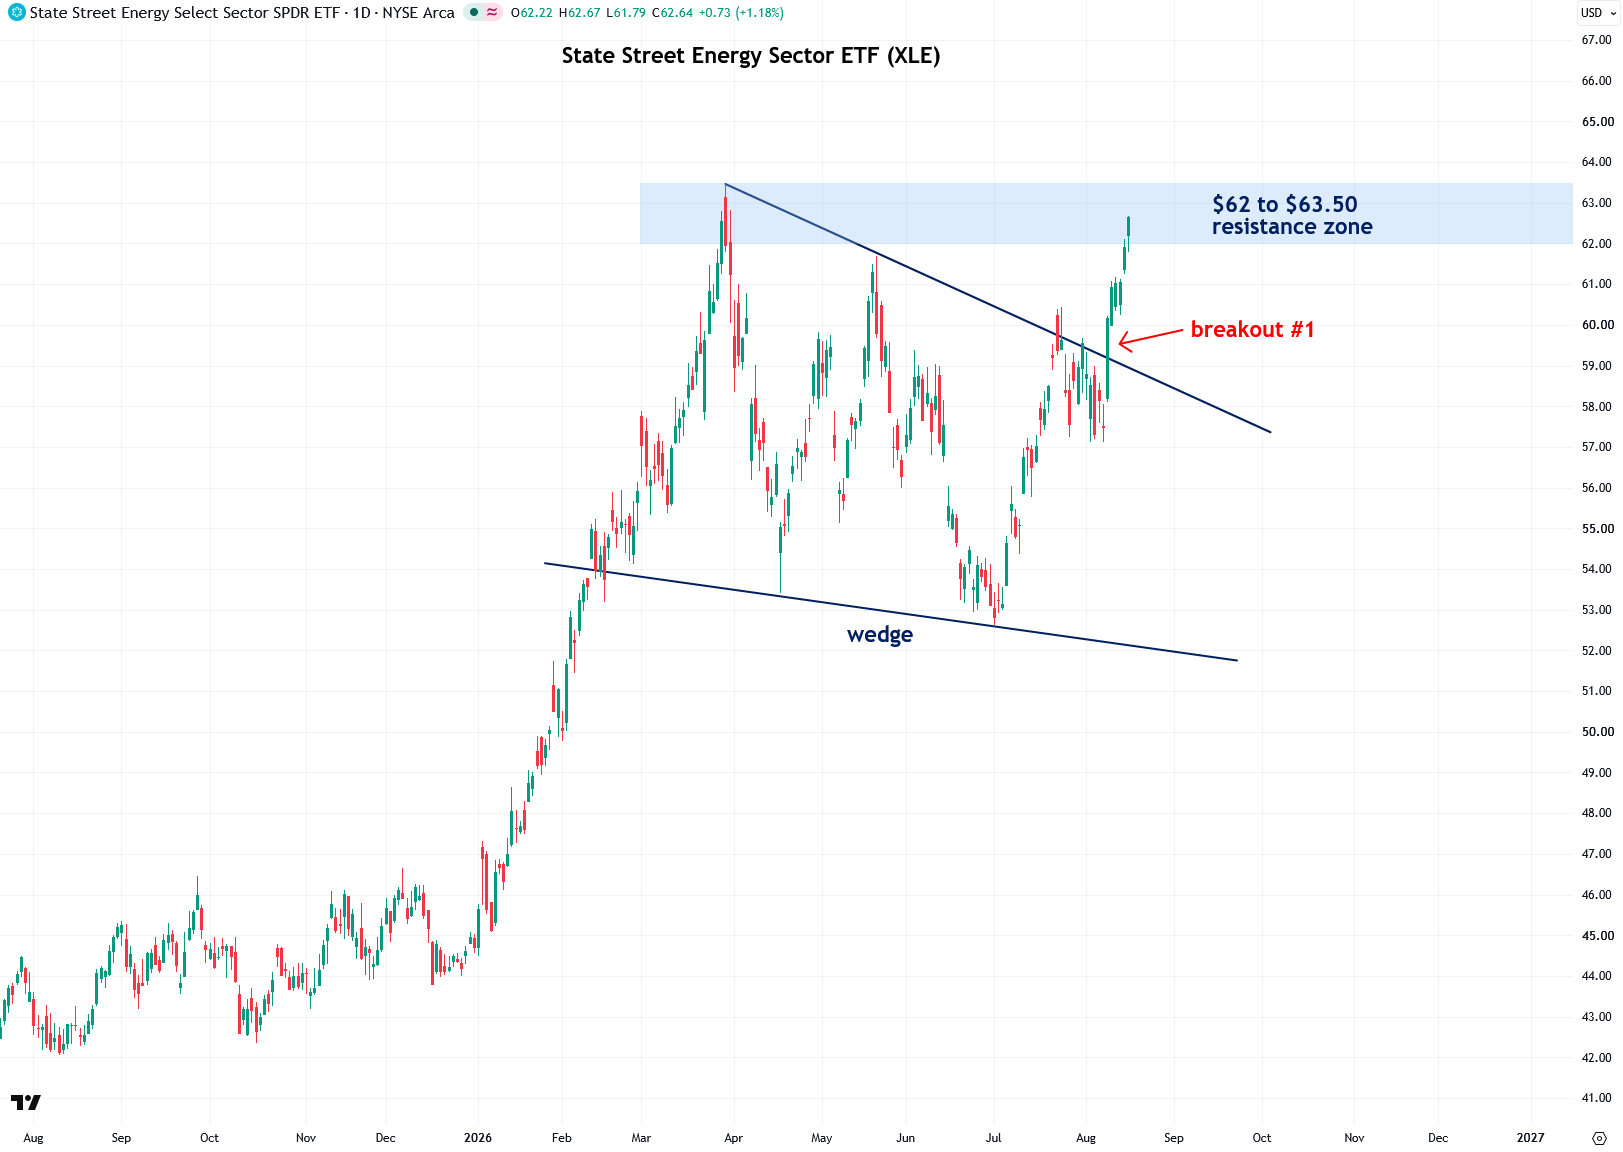
Zooming in on the daily chart of XLE, there was an initial surge from December through March, followed by a period of consolidation that formed a wedge pattern. XLE broke out of that wedge last week, providing the first bullish signal, but the next and more important signal will come if it decisively closes above the $62 to $63.50 resistance zone formed by the peaks in March and May.
As a reminder, breakouts above horizontal resistance zones and levels are generally more reliable and significant than breakouts above diagonal resistance levels, such as the upper boundary of the wedge. A decisive breakout above the $62 to $63.50 resistance zone would therefore provide another potential entry opportunity for those interested.
That said, XLE is a bit extended in the short term, so I would not jump in just yet. I would rather see a brief period of consolidation first, followed by a decisive breakout above the $62 to $63.50 resistance zone.
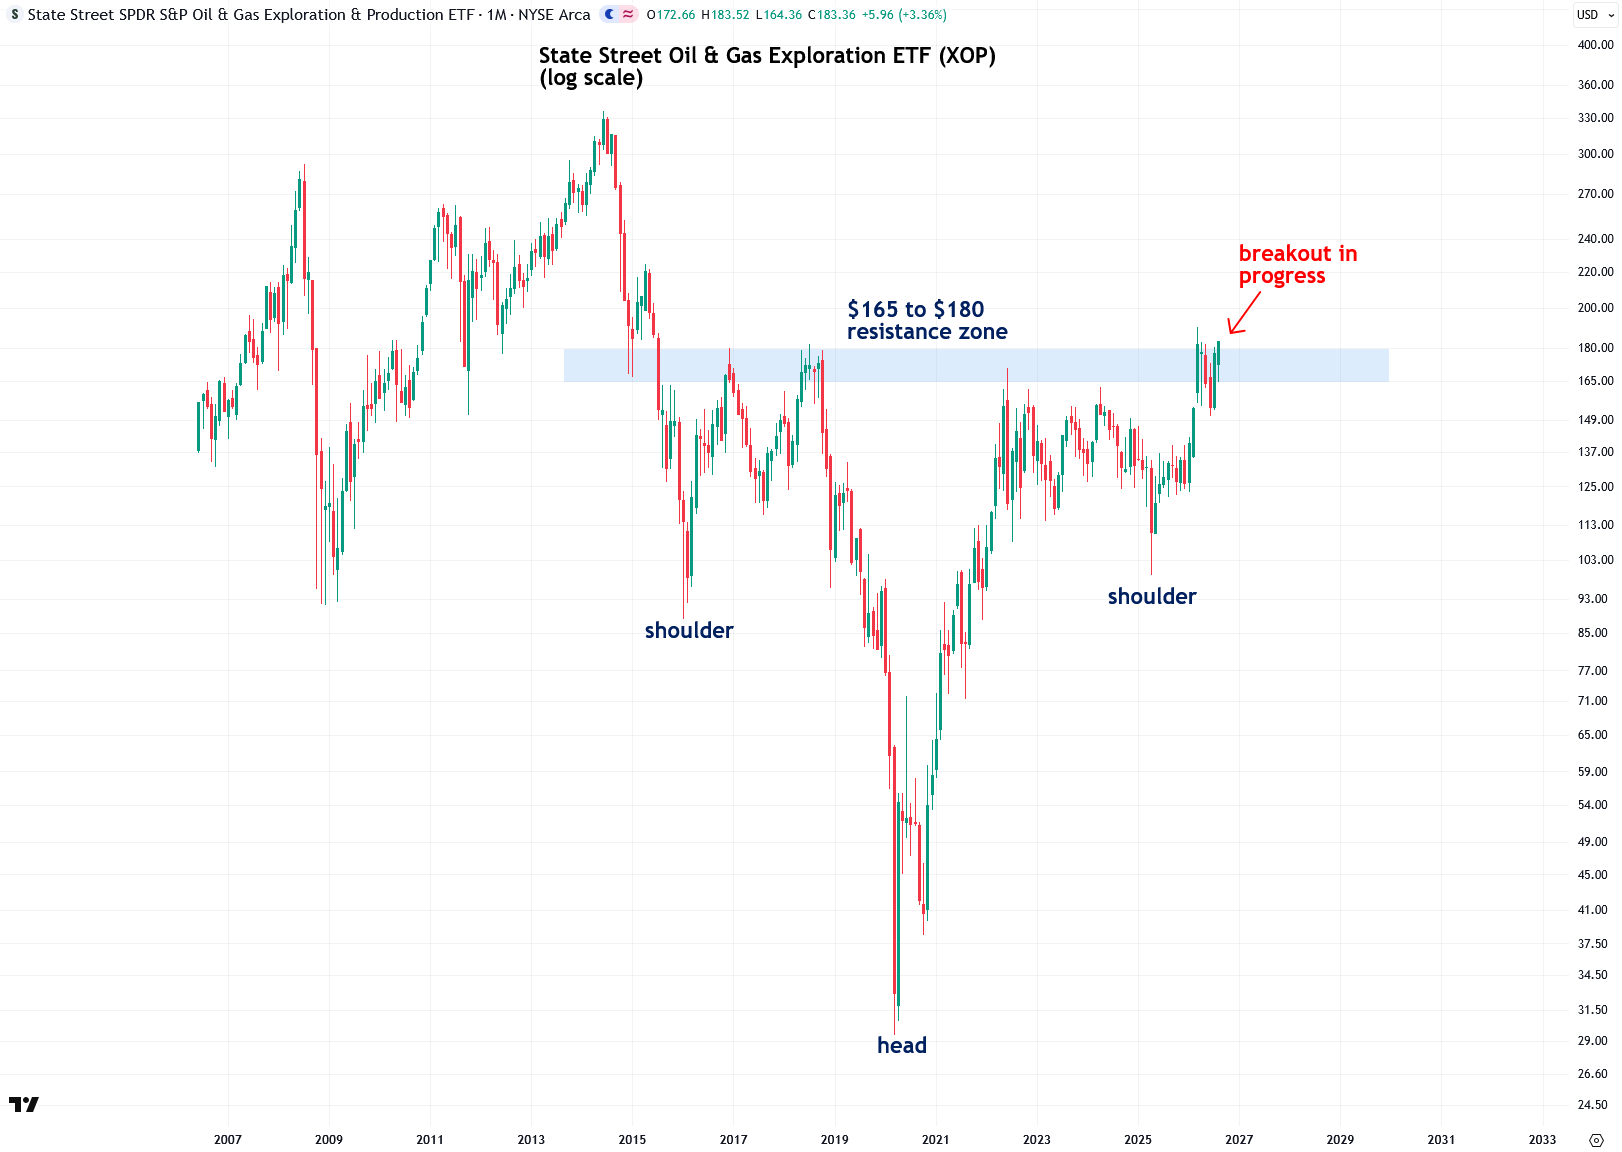
While XLE is largely focused on large integrated oil companies, oil and gas exploration companies often rise even more during energy bull markets, making them a higher-“torque,” or higher-beta, way to bet on an energy boom, albeit with greater volatility and risk.
The long-term chart of the State Street Oil & Gas Exploration ETF (XOP) shows what appears to be a massive head-and-shoulders bottom pattern that has been forming for roughly a decade, with a key resistance zone between $165 and $180.
XOP is now beginning to break above that resistance zone, and assuming it can successfully close above it, I believe there is a very good chance that a powerful bull market in oil and gas exploration companies lies ahead in the coming years. I’ll discuss the individual stocks in this arena that I like most shortly.
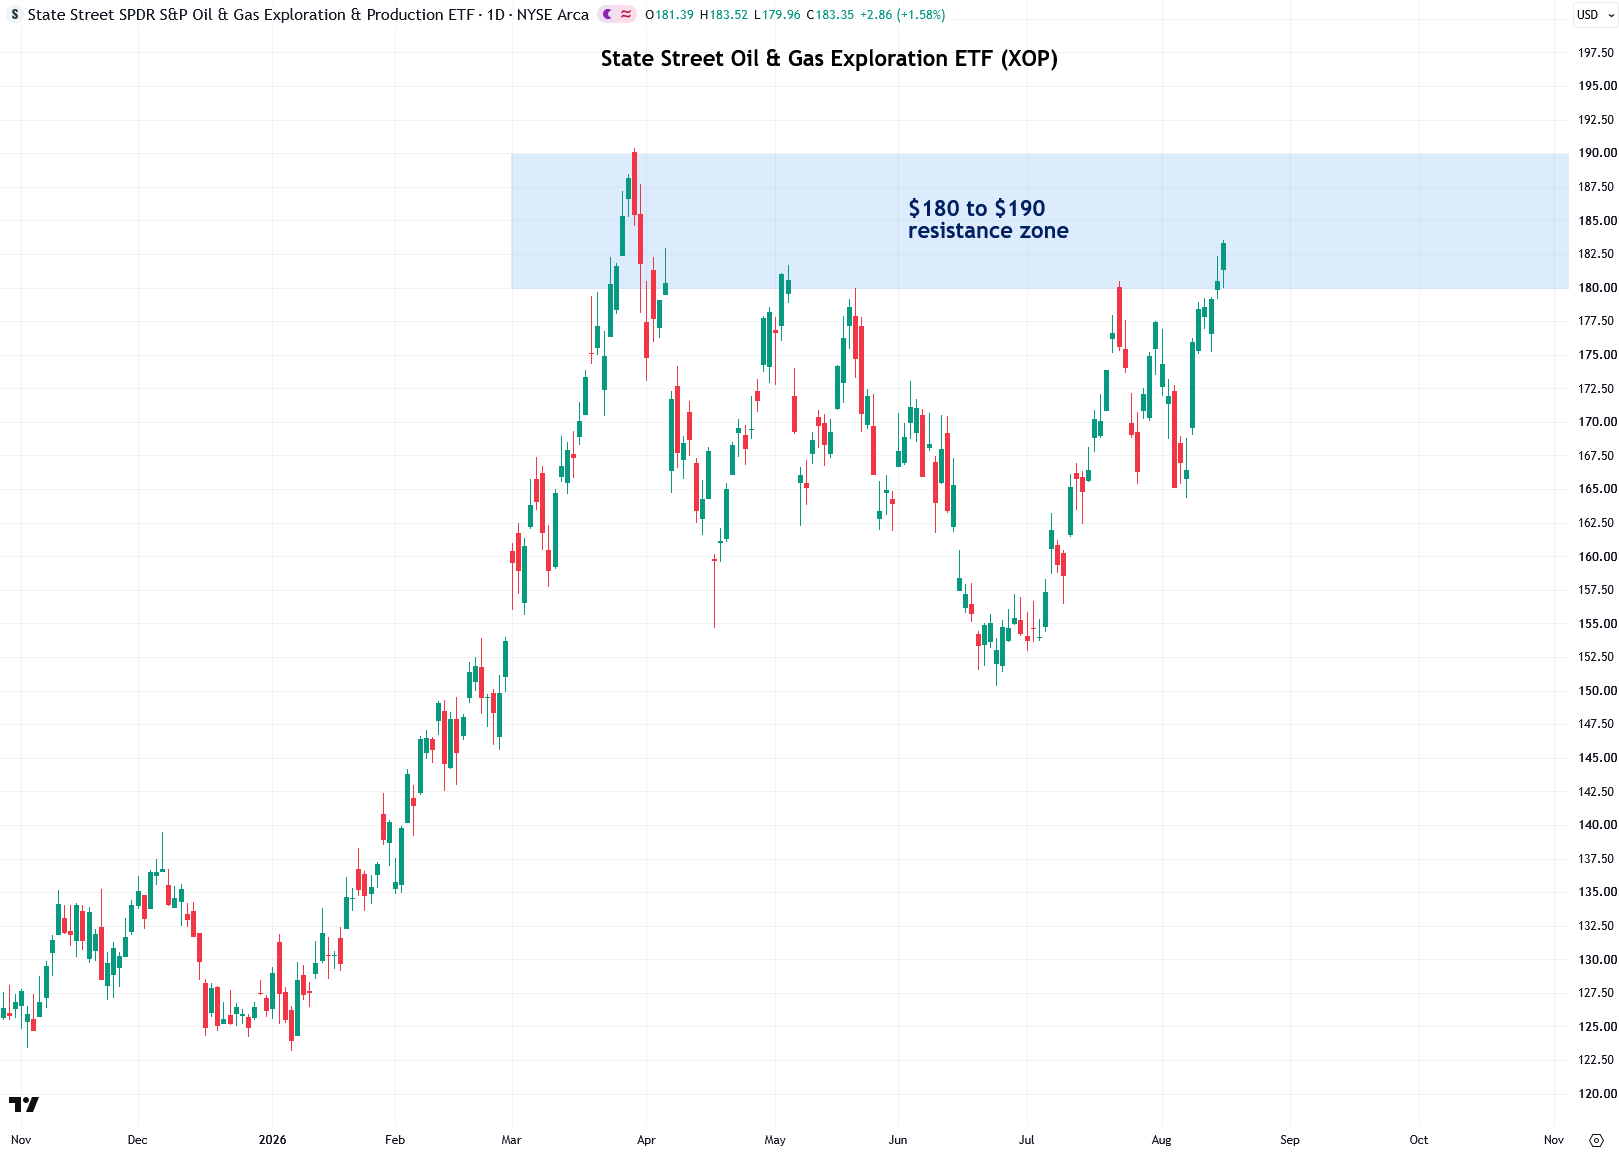
A look at the daily chart of XOP shows that it is now beginning to push into another shorter-term resistance zone between $180 and $190, formed by the peaks since March.
If XOP can decisively break above that zone, I would expect another powerful surge like the one at the start of the year, likely setting the stage for an even more extensive bull market over the next decade or so.
Now I want to discuss the different industry groups within the overall energy sector and which ones have the greatest potential during an energy supercycle. To start, there are the massive integrated energy companies like Exxon Mobil and Chevron, which operate across the entire energy value chain, including oil and gas exploration, production, refining, and retailing.
While these companies are stable and highly profitable, their enormous size and diversification, with Exxon Mobil sporting a market capitalization of roughly $664 billion, can limit their upside during an energy supercycle compared with smaller, more nimble, and more leveraged companies involved in exploration and production, drilling, oilfield services, and energy machinery and equipment.
Next, there are midstream companies that specialize in the processing, storage, transportation, and marketing of petroleum products. While these companies are often profitable and stable, they typically do not rise nearly as much as exploration and production, drilling, and oilfield services companies during an energy supercycle.
That is because their profits are driven more by the volume of petroleum products they process and transport than by direct exposure to rising oil and gas prices. For that reason, I would generally avoid these companies when specifically trying to position for maximum upside during an energy supercycle.
Next, there are oil refining companies such as Valero, Marathon Petroleum, Phillips 66, and HF Sinclair. While refiners are typically not the strongest performers during an energy supercycle, in recent months they have actually been among the best-performing stocks not only within the energy sector, but across the broader stock market.
This exceptional performance has been driven by record profitability resulting from the extremely high prices of refined products such as gasoline and diesel/heating oil relative to crude oil, largely due to disruptions related to the Iran and Russia-Ukraine wars.
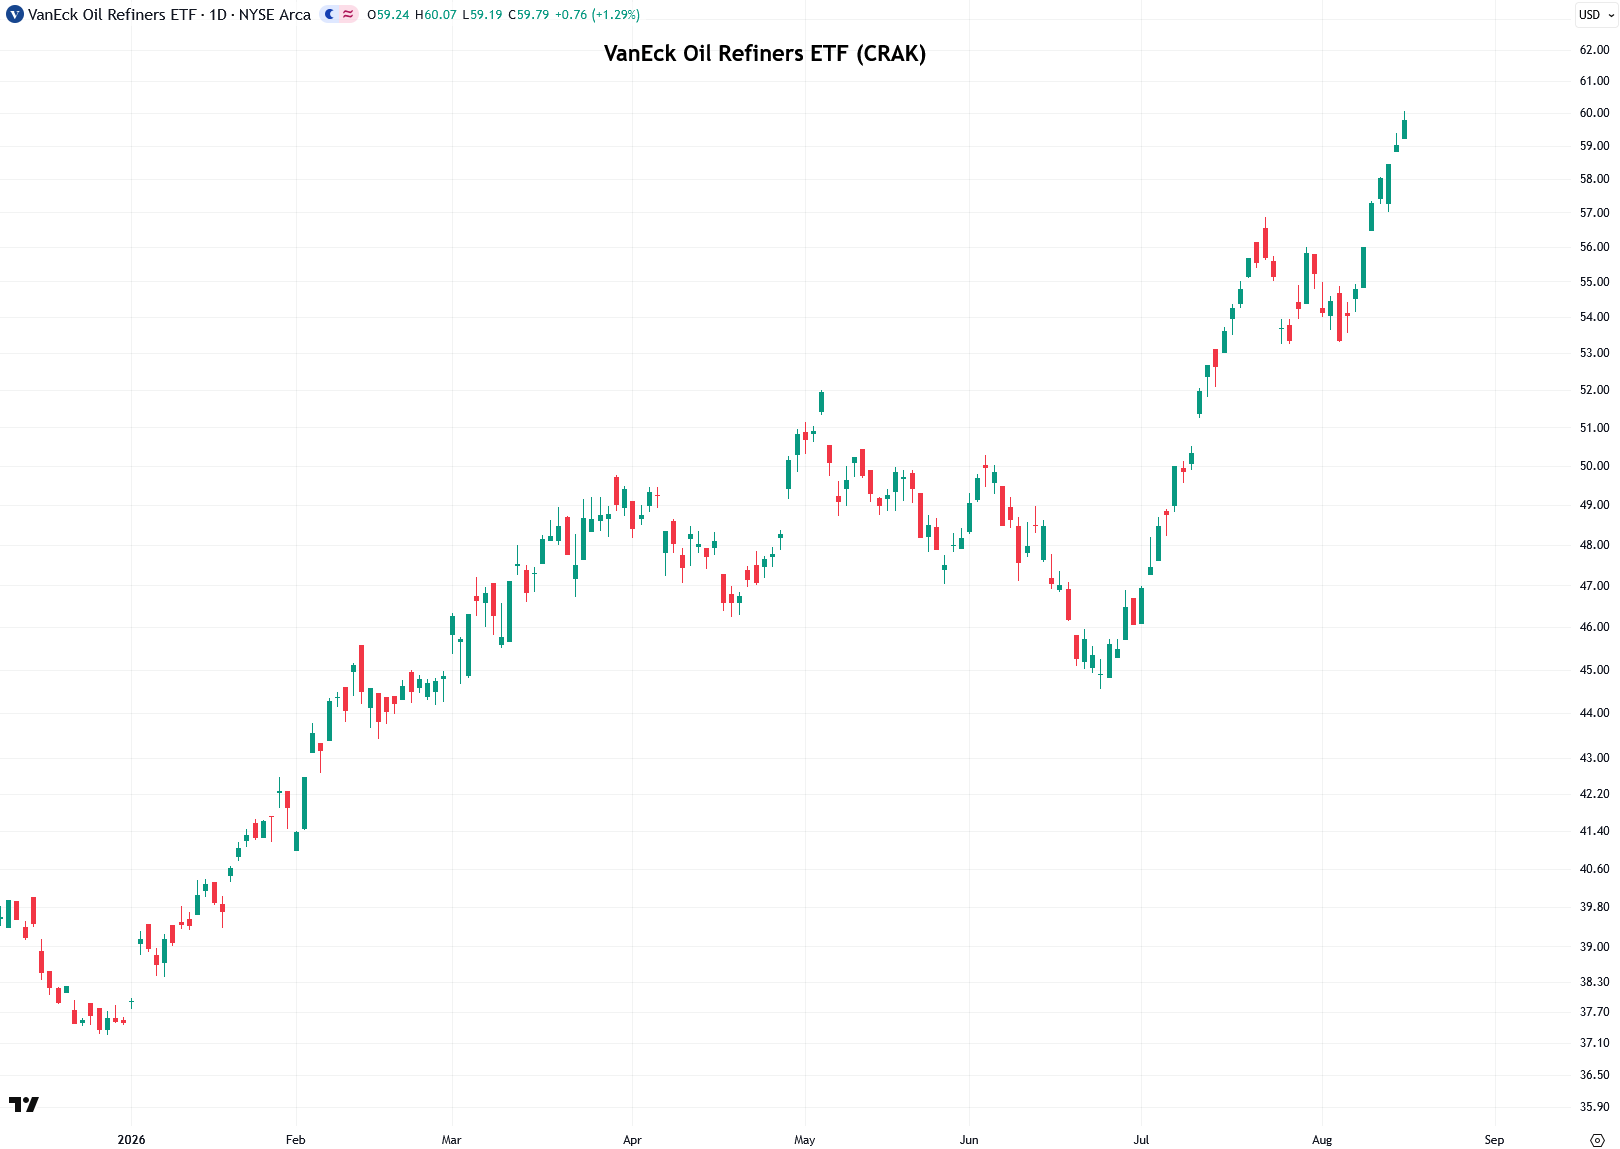
The VanEck Oil Refiners ETF (CRAK) specifically tracks oil refining stocks, and the chart below shows their stellar performance since the start of the year. However, I would avoid jumping in right now because the industry group is quite extended, meaning there is not a particularly low-risk entry opportunity at the moment.
I am also personally less interested in refiners as a way to play the long-term energy supercycle because, aside from the extraordinary conditions created by the current war, they have historically offered less upside than the more highly leveraged energy industry groups I have discussed.
Next, we get to the oil services industry group, which provides specialized engineering, drilling, testing, maintenance, and other critical services to oil and gas producers. This is where some of the most explosive performers can be found during energy bull markets, but typically only after the bull market heats up enough to trigger a major CAPEX boom among oil and gas producers.
In the earlier stages, producers tend to remain focused on fiscal discipline, paying dividends, and buying back stock rather than aggressively expanding capital spending, which is largely where we are today.
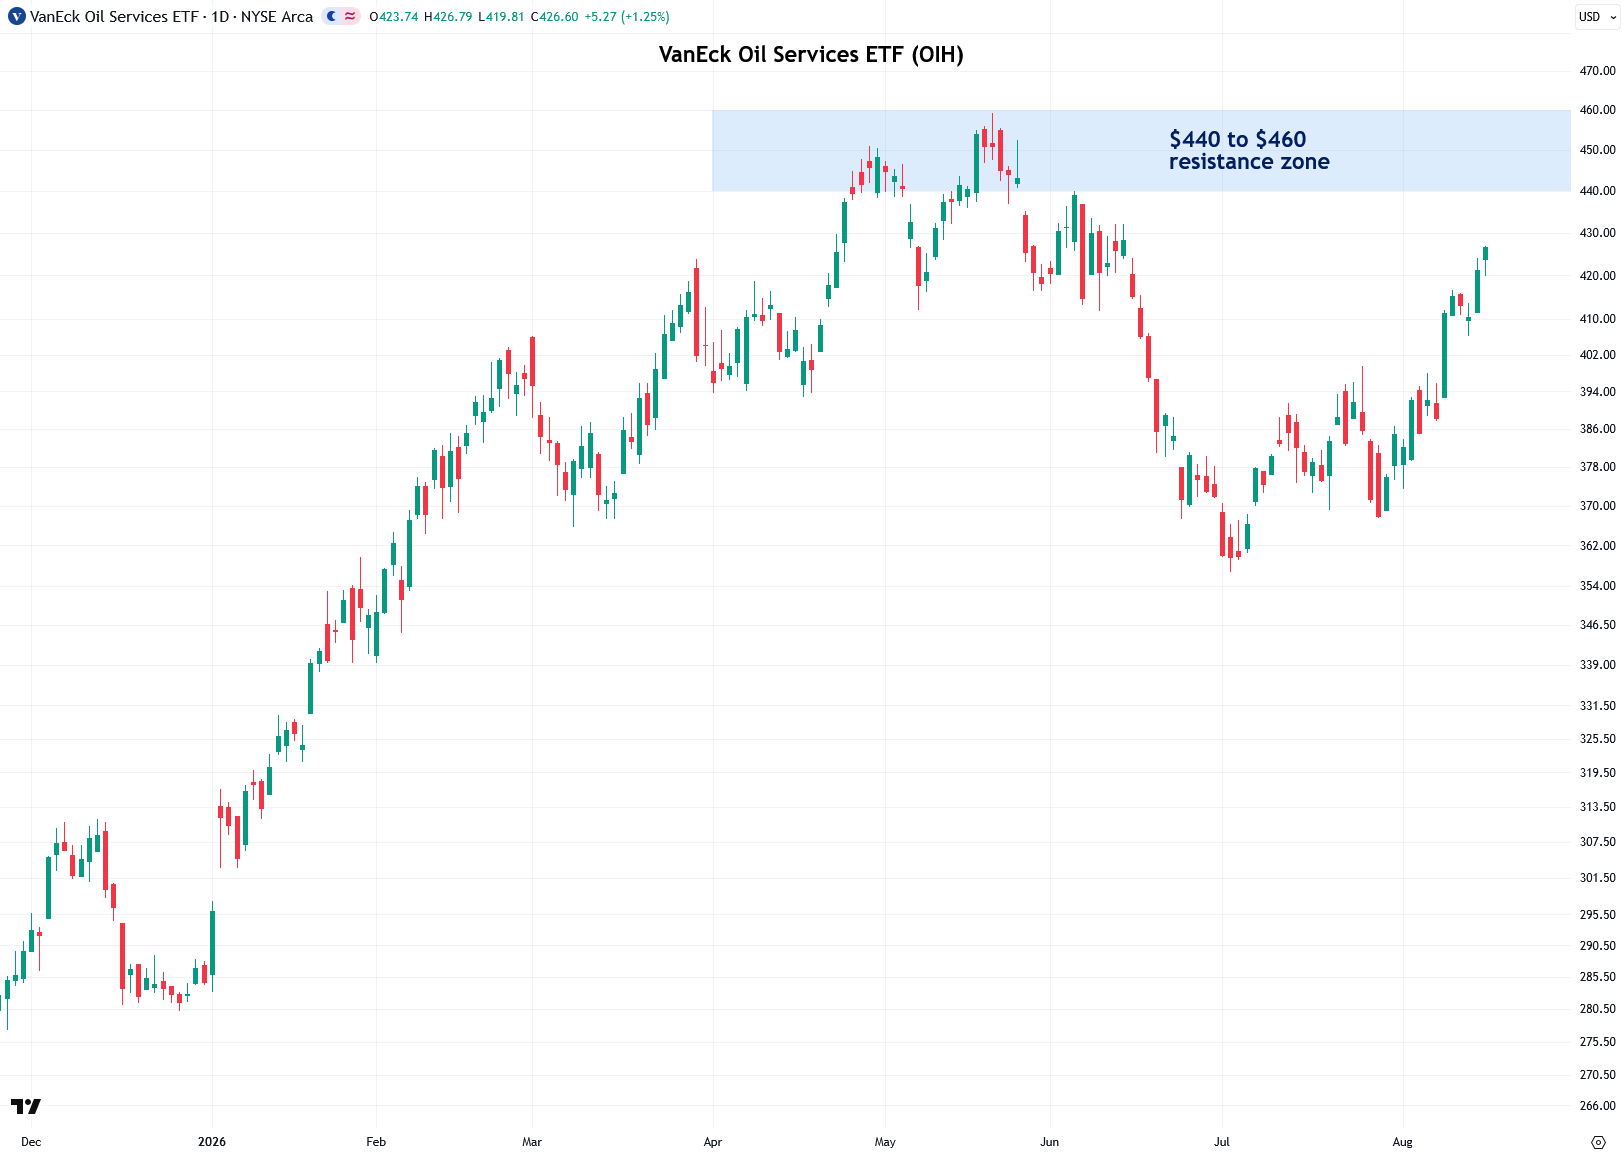
The VanEck Oil Services ETF (OIH) is an excellent and efficient way to gain exposure to this industry group, with holdings that include major oilfield services companies such as Schlumberger, Baker Hughes, and Halliburton, as well as drilling firms like Transocean, Valaris, and Nabors Industries.
From a technical perspective, OIH has lagged some of the other energy industry groups due to limited CAPEX spending so far, though I expect that to change quickly upon another surge in oil prices and certainly as the energy supercycle gets further underway.
Right now, I am keeping a close eye on the $440 to $460 resistance zone. A decisive breakout above that zone, ideally following a period of sideways consolidation just beneath it, would provide an excellent opportunity to go long OIH as well as the individual stocks it holds.
Now I want to share the individual energy stocks within each major industry group that I believe have the greatest potential during an energy supercycle, excluding slower-moving refiners and midstream companies.
The methodology I used is based on Investor’s Business Daily’s (IBD) CANSLIM approach, which I greatly respect, though I have modified it somewhat because CANSLIM is ideally suited for long-term compounding growth stocks, whereas natural resources stocks are cyclical in terms of their earnings and valuation metrics.
To find these stocks, I used IBD’s MarketSurge platform to screen for U.S.-traded oil and gas stocks with the highest relative strength, earnings growth rates, and profit margins.
Relative strength is one of the main components of the CANSLIM approach and measures a stock’s price performance relative to the rest of the market. It is expressed as a rating from 1 to 99, so a relative strength (RS) rating of 96 means that the stock has outperformed 96% of all other stocks, placing it in the top 4% for relative strength. The biggest stock market winners in history have typically sported Relative Strength Ratings of 85 or higher.
The other key CANSLIM metric is earnings per share (EPS) growth, which is also expressed as a rating from 1 to 99. The greatest stock market winners throughout history have typically sported high EPS ratings, often even before embarking on their most powerful bull runs. The idea is not to speculate on potential future earnings growth that may or may not materialize, or on exciting business prospects that remain far off in the future, but rather to focus on stocks that are already demonstrating superior earnings performance and strong underlying economics.
So, without further ado, here is my list of the strongest oil and gas companies that I believe have the greatest potential in the coming energy supercycle:
Cenovus Energy (CVE)
Cenovus Energy is an integrated oil company headquartered in Calgary, Canada, that trades on the New York Stock Exchange and has a market capitalization of approximately $59 billion. Together with its subsidiaries, Cenovus develops, produces, refines, transports, and markets crude oil, natural gas, and refined petroleum products, with operations primarily in Canada, the United States, and China.
Cenovus is currently the highest-rated integrated oil company according to Investor’s Business Daily, with a solid relative strength rating of 87 and an even more impressive earnings per share (EPS) rating of 92. Together with its other metrics, this gives Cenovus an excellent composite rating of 95, which combines factors including relative strength, earnings and sales growth, profit margins, and institutional accumulation.
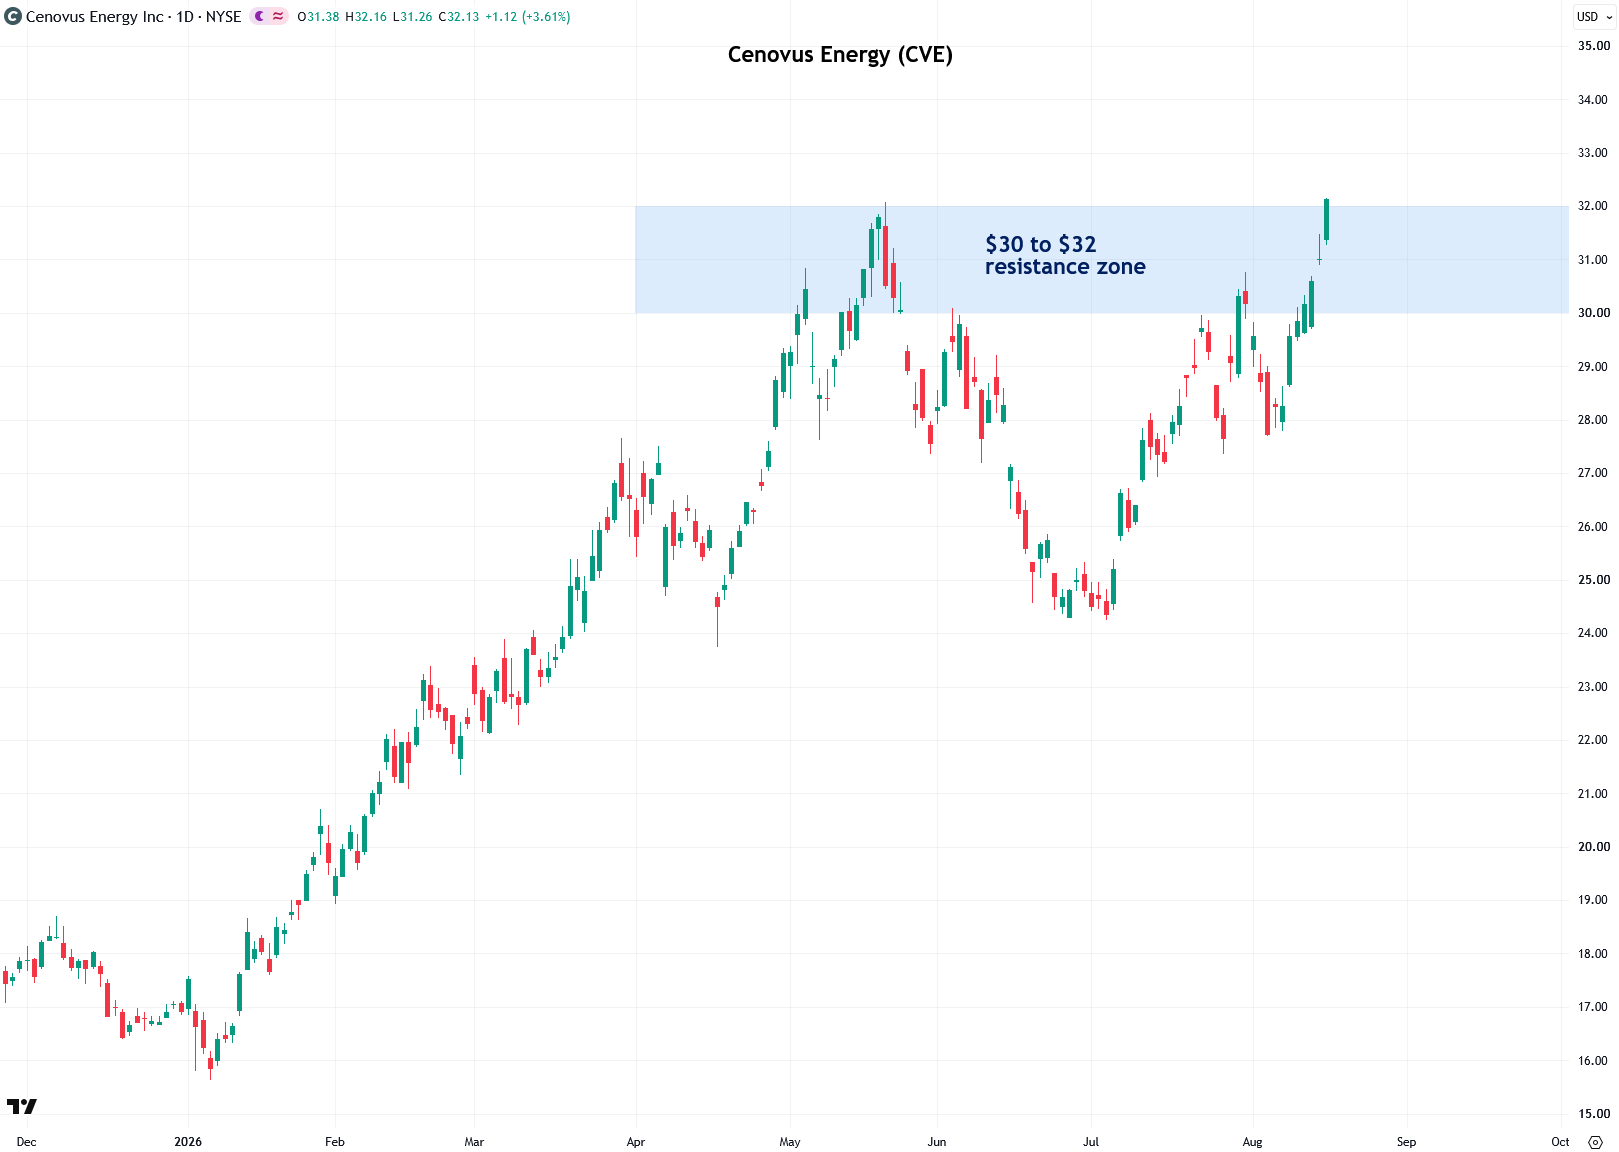
From a technical perspective, Cenovus has a key resistance zone between $30 and $32. As of Monday, the stock began pushing above that zone but has not yet closed decisively enough above it to qualify as a successful breakout. That could occur over the next few days, and I would prefer to see the breakout accompanied by heavy volume for even greater confirmation (learn more).
(Note that while I said earlier that very large integrated oil companies like Exxon Mobil and Chevron are generally not the strongest performers for participating in an energy supercycle, I am much more amenable to smaller, high-quality integrated oil companies like Cenovus and Equinor, which I will discuss next.)
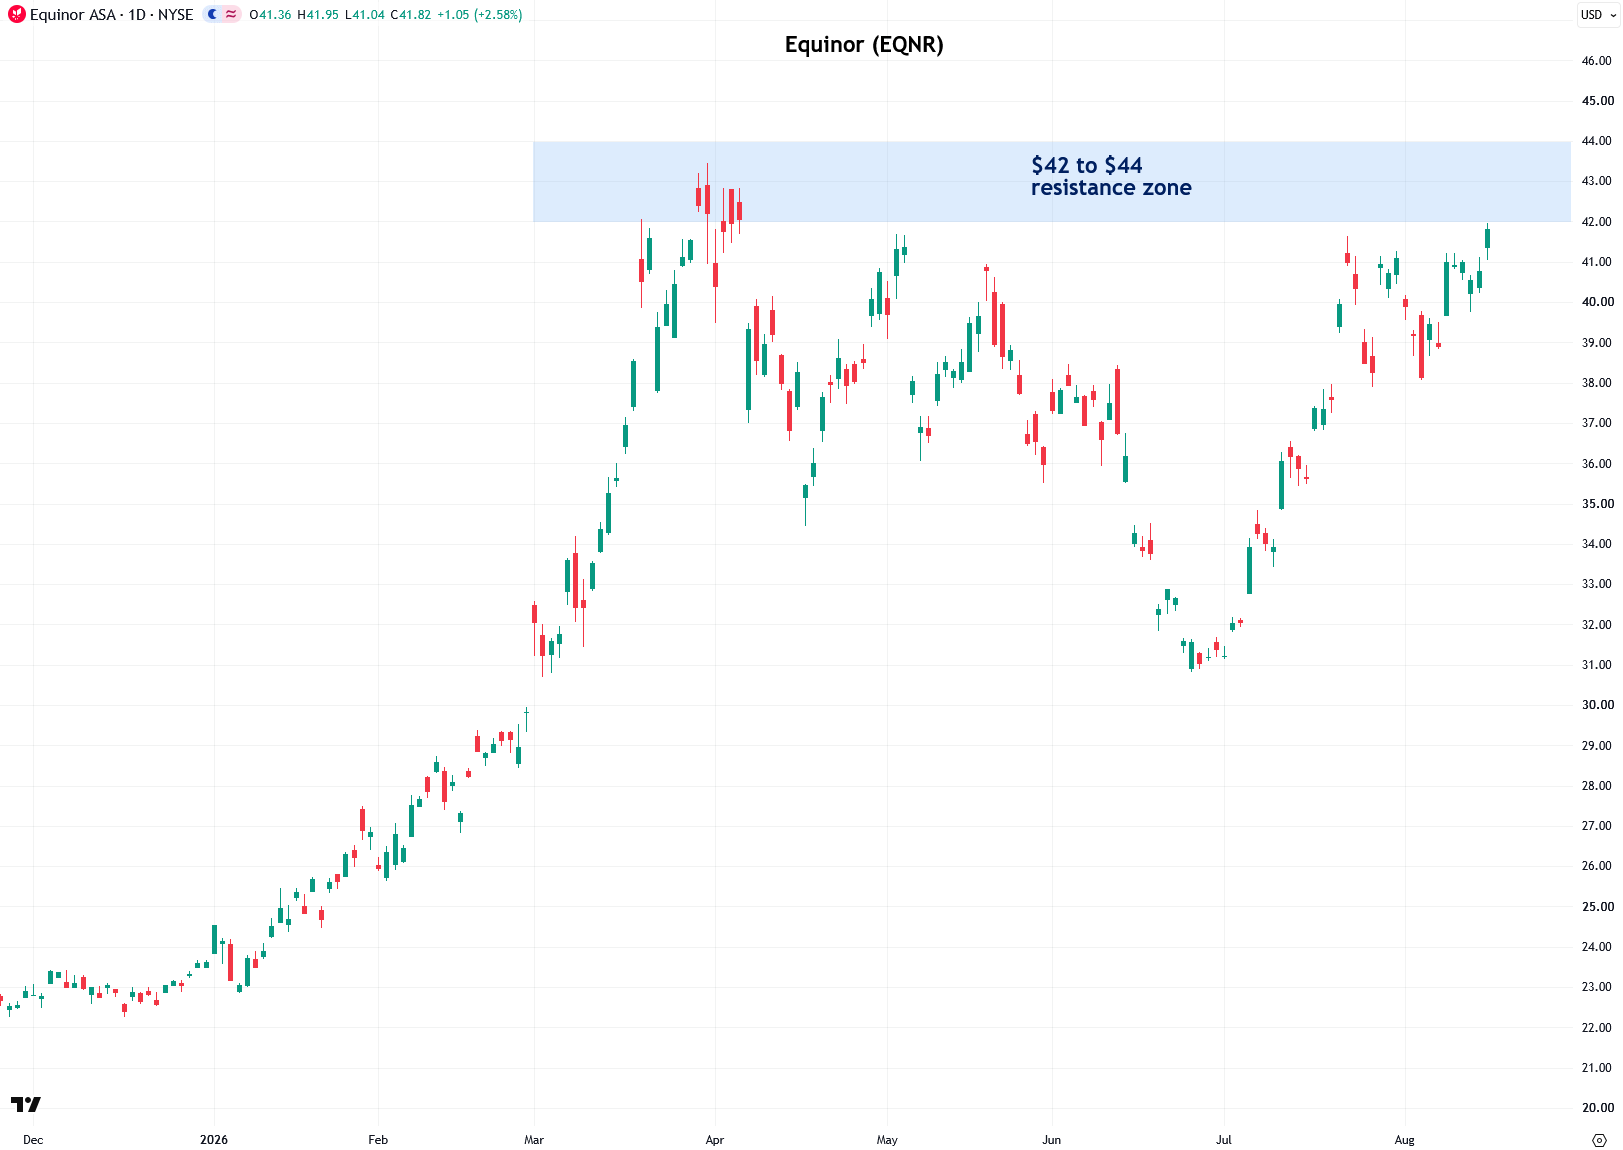
Equinor (EQNR)
Equinor, formerly known as Statoil ASA, is a Norwegian integrated oil and gas company that trades on the New York Stock Exchange and has a market capitalization of approximately $99 billion.
Equinor is currently the second-highest-rated integrated oil company according to Investor’s Business Daily, with a respectable relative strength rating of 85 and an earnings per share (EPS) rating of 85. Together with its other metrics, this gives Equinor an impressive composite rating of 96.
From a technical perspective, Equinor is now trading just below its $42 to $44 resistance zone, formed by the major peaks of the past six months. A decisive breakout above that zone on strong volume would likely kick off another powerful rally phase similar to the one at the start of the year.
EOG Resources (EOG)
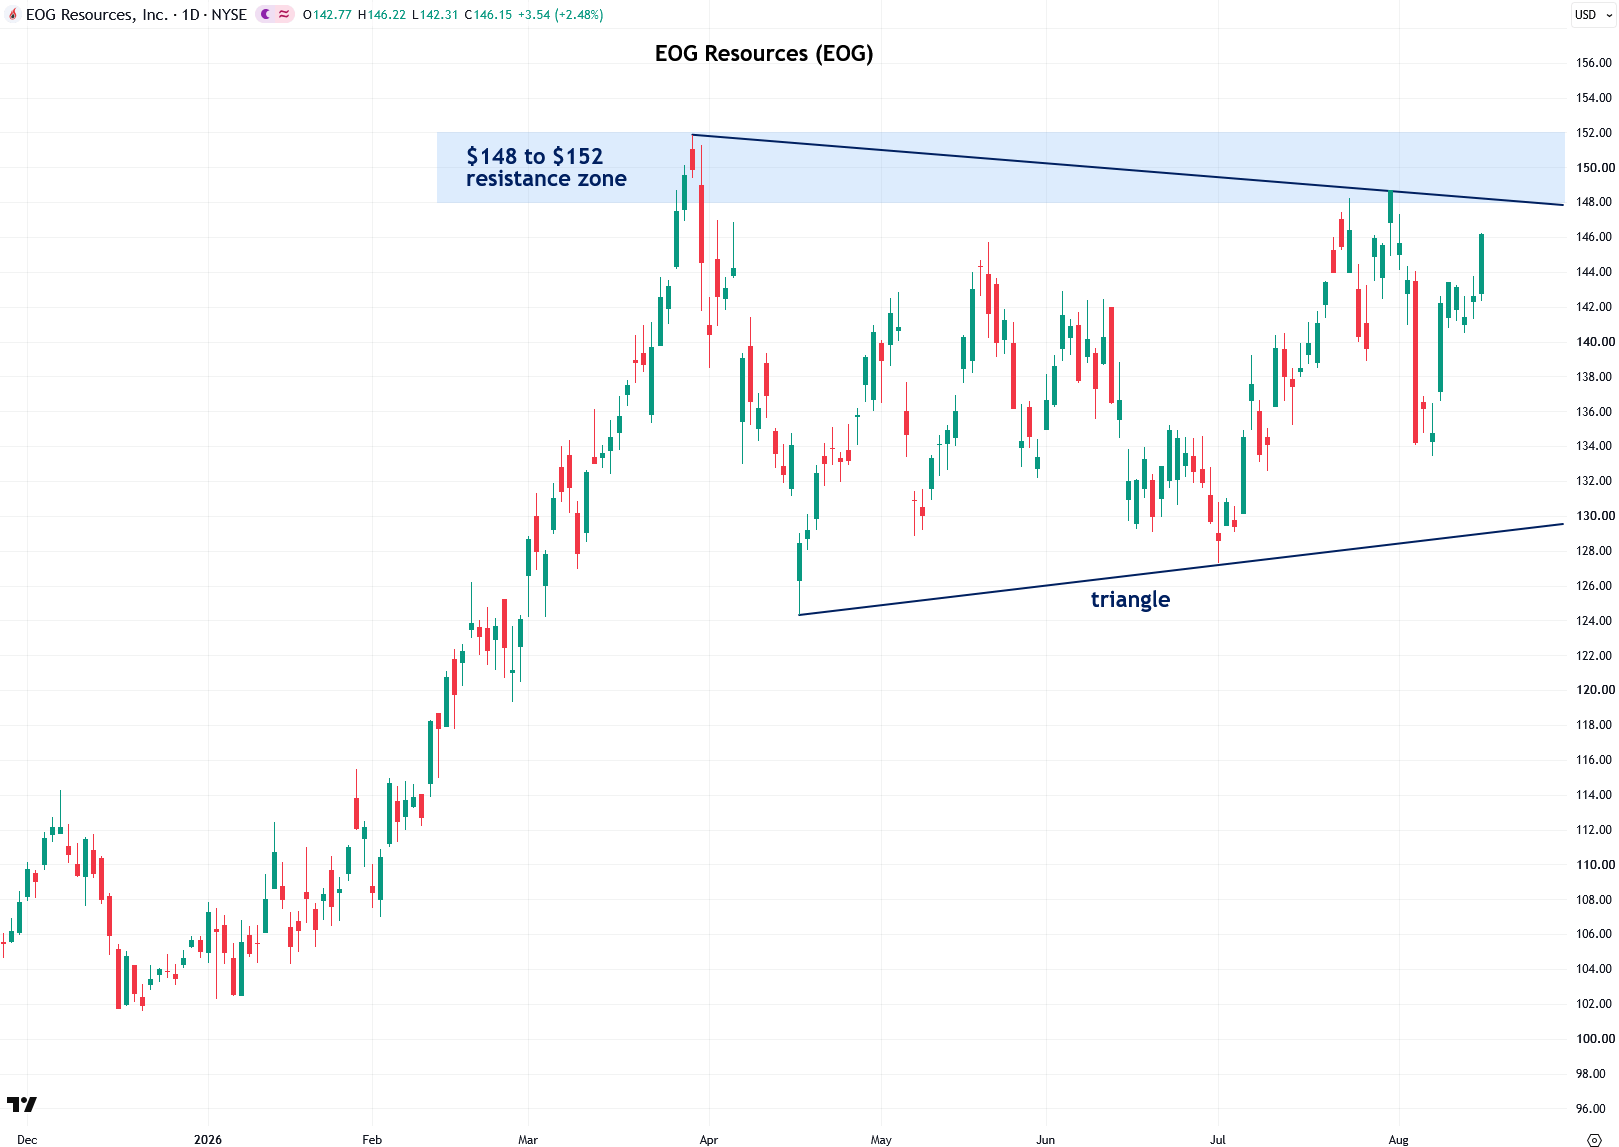
EOG Resources is a major oil and gas exploration and production company headquartered in Houston, Texas, that trades on the New York Stock Exchange and has a market capitalization of approximately $77 billion.
EOG Resources has consistently ranked among the highest-rated oil and gas exploration companies in recent weeks according to Investor’s Business Daily, with a relative strength rating of 73 and an earnings per share (EPS) rating of 81. Together with its other metrics, this gives EOG Resources a strong composite rating of 94.
Note that it is still relatively early in the oil and gas exploration cycle, so the metrics for these stocks are somewhat weaker than those of the integrated oil companies. However, I expect that to change, with many more opportunities emerging in this industry group as the energy supercycle heats up.
From a technical perspective, EOG Resources has been consolidating since March in a triangle/wedge pattern just below the $148 to $152 resistance zone formed by the major peaks during that period. A decisive, high-volume breakout above that resistance zone would likely kick off another powerful surge similar to the one at the start of the year. I expect EOG Resources to be one of the strongest performers in the energy supercycle ahead, just as it was during the powerful energy supercycle of the 2000s.
Transocean (RIG)
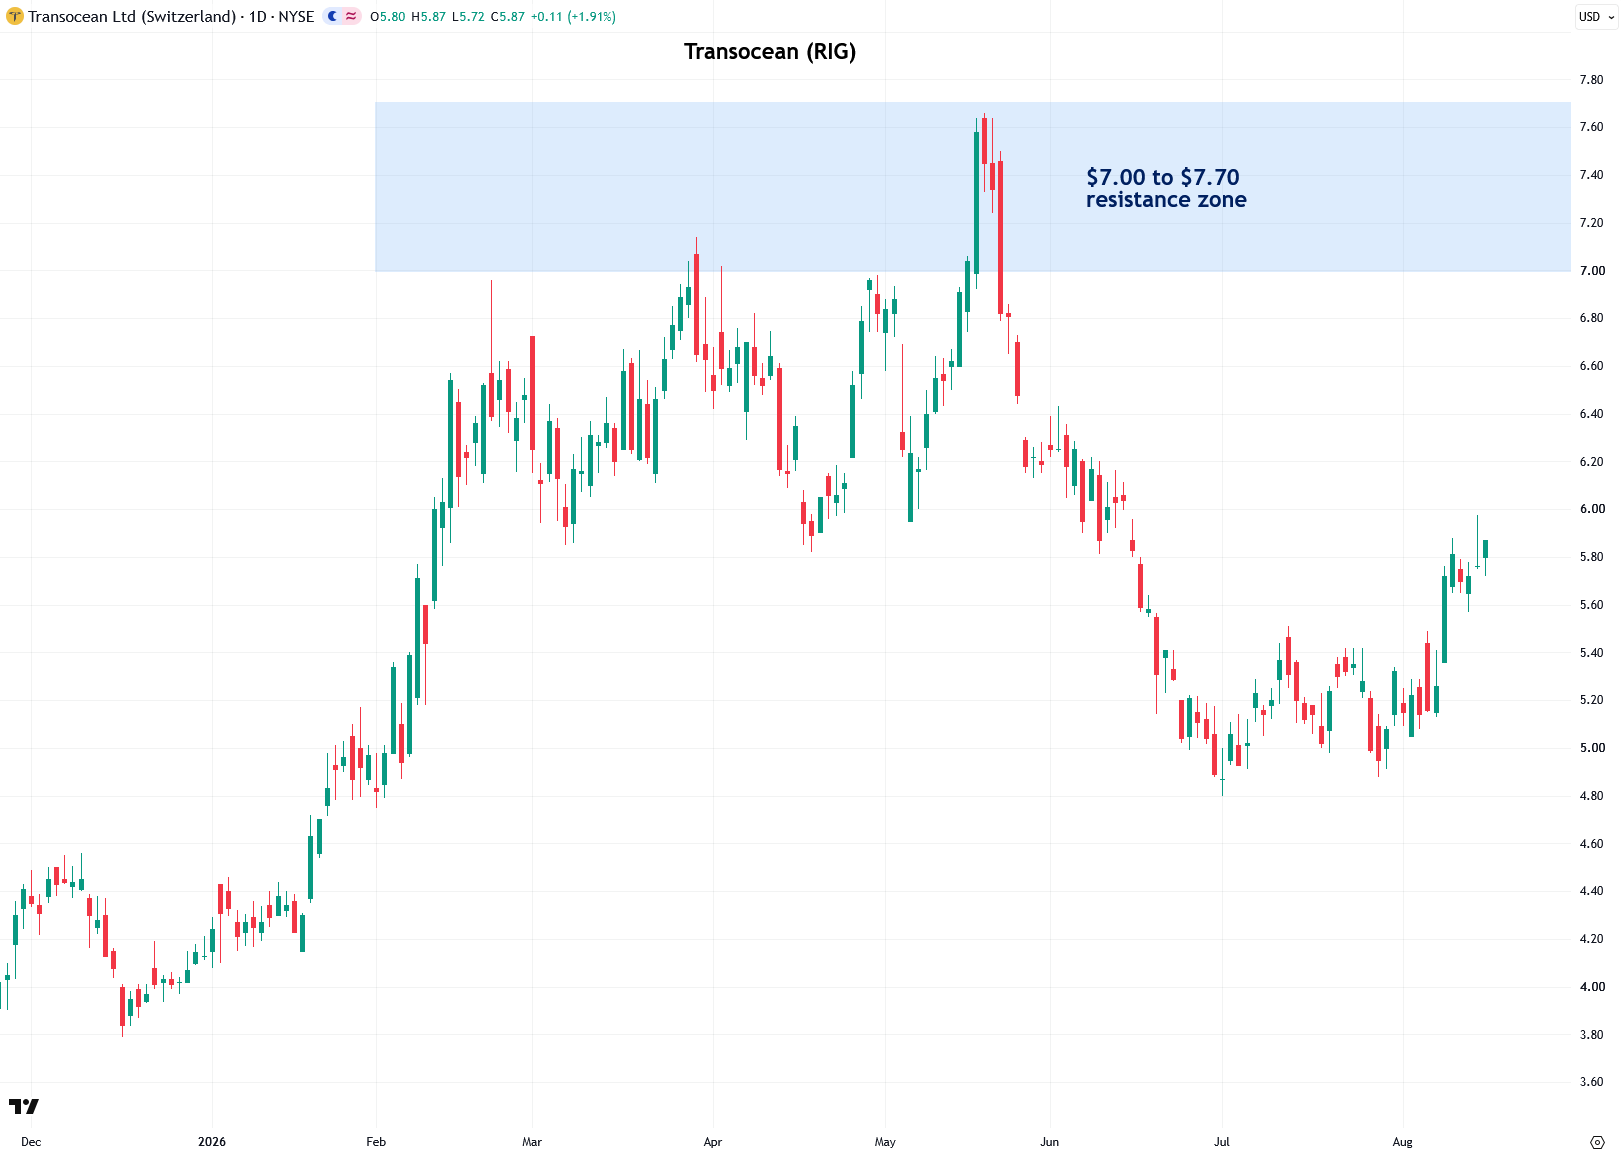
Transocean is a Switzerland-based offshore drilling company that trades on the New York Stock Exchange and has a market capitalization of approximately $6.5 billion. Transocean is slated to merge with another prominent offshore driller, Valaris, by the end of the year, potentially creating an offshore drilling powerhouse. However, there is still an element of regulatory risk if the merger is not approved, so I remain somewhat cautious until the deal is finalized.
Interestingly, Transocean and Valaris are currently the two highest-rated oil and gas drilling companies according to Investor’s Business Daily. Transocean has a relative strength rating of 54 and an earnings per share (EPS) rating of 72, which, together with its other metrics, gives the company a composite rating of 60.
Note that, as with exploration companies and oilfield services, the oil drilling industry group is still very early in its cycle, so the metrics for these stocks are not particularly impressive just yet. However, I expect that to change significantly as the energy supercycle heats up.
From a technical perspective, Transocean has a key resistance zone between $7.00 and $7.70. The ideal entry setup I would like to see is a rally back toward that zone, followed by a period of consolidation and rising relative strength, and then a decisive, high-volume breakout. If that occurs, I expect Transocean to be one of the strongest performers of the energy supercycle once CAPEX spending picks up, just as it was during the 2000s cycle.
CF Industries (CF)
CF Industries is a major manufacturer and distributor of agricultural fertilizers headquartered in Northbrook, Illinois. The company trades on the New York Stock Exchange and has a market capitalization of approximately $18 billion.
While CF Industries is not technically part of the energy sector, but rather the basic materials sector and agricultural chemicals industry group, it can be considered energy-adjacent because fertilizer prices, and consequently fertilizer company stock prices, are highly correlated with energy and grain prices. CF Industries is therefore well positioned to benefit from the broader commodities supercycle that I expect over the decade ahead. It was also one of the most stellar performers during the 2000s commodities supercycle, when its stock soared roughly 15-fold.
Fertilizer prices have surged due to disruptions in the Strait of Hormuz, along with the resulting rise in grain prices, making the risk of a global food crisis increasingly serious. As morbid as it sounds, and I certainly hope this scenario does not occur, CF Industries should serve as a strong hedge against that risk. If oil prices experience another major spike, I expect CF Industries to be a significant beneficiary.
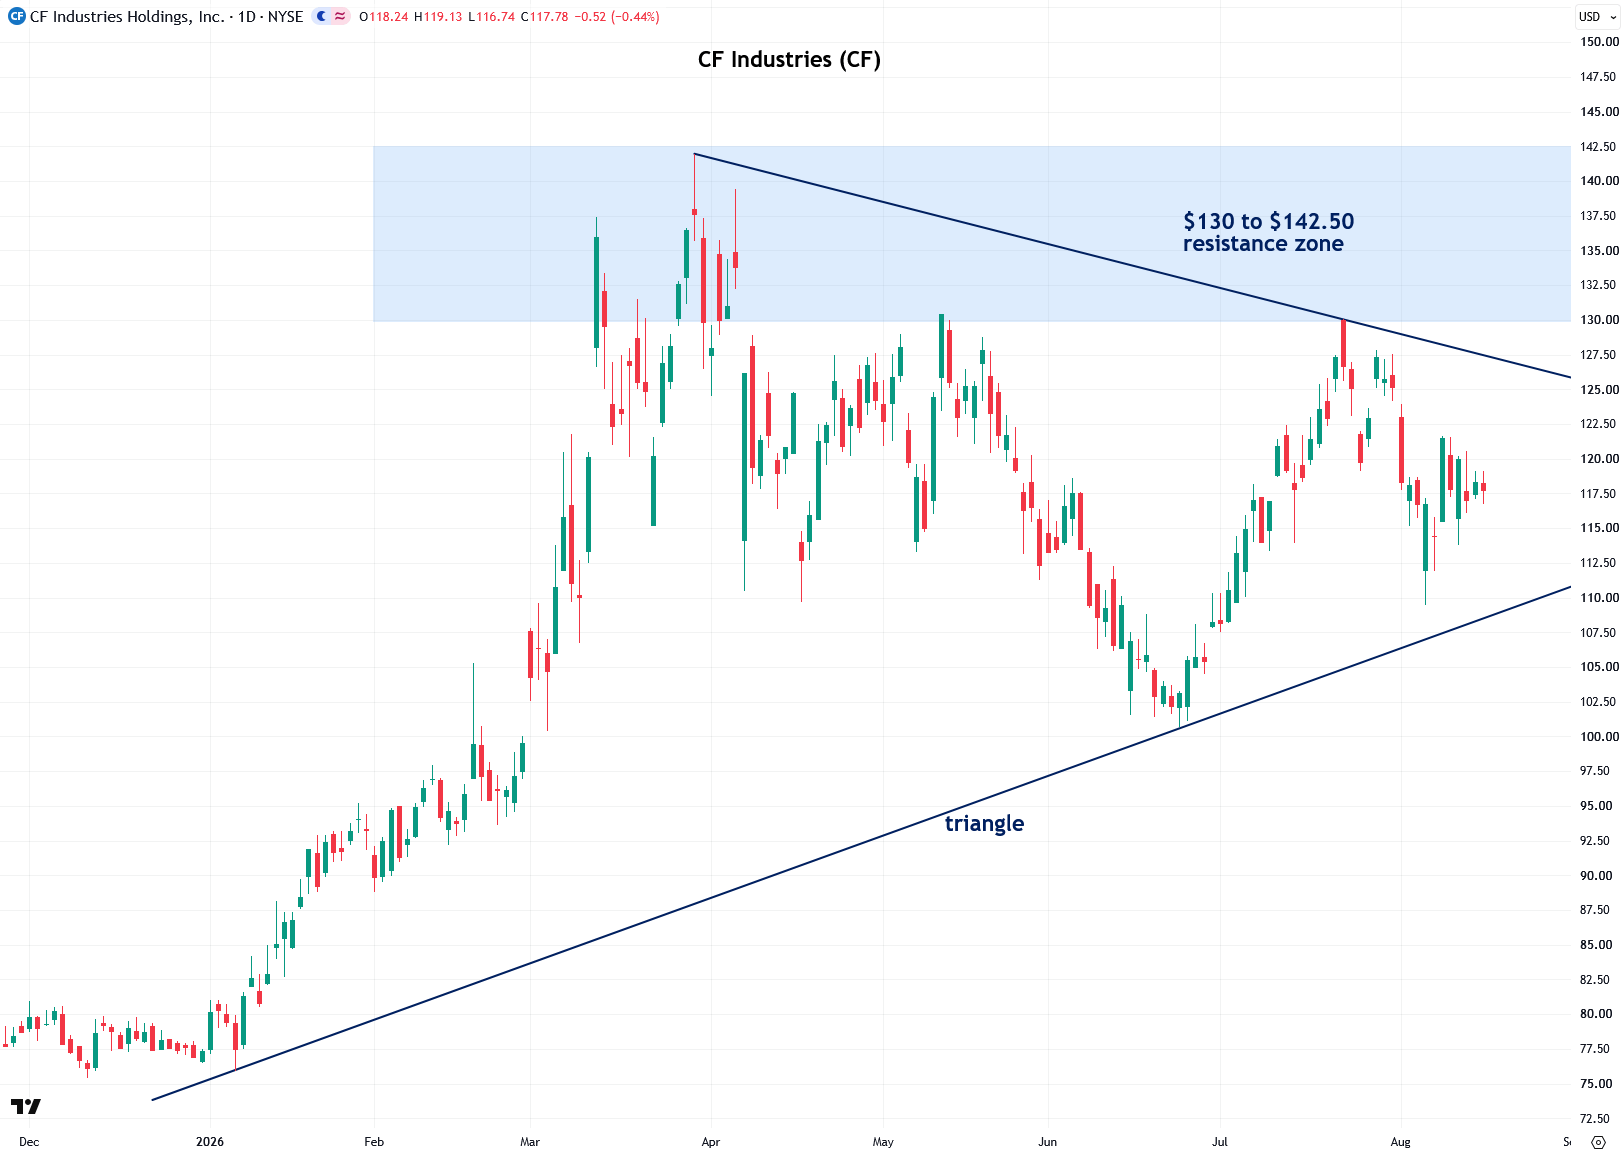
CF Industries is currently the highest-rated agricultural chemicals company according to Investor’s Business Daily, with a relative strength rating of 59 and an impressive earnings per share (EPS) rating of 92. Together with its other metrics, this gives CF Industries a composite rating of 78.
From a technical perspective, CF Industries surged along with oil prices from January through March but has since been consolidating in a triangle pattern for the past five months, with a key resistance zone between $130 and $142.40. I am now watching for a convincing, high-volume breakout above both the triangle pattern and the resistance zone, which I believe is likely to kick off another powerful rally, especially if it occurs in conjunction with a breakout in oil prices.
We’ve finally come to the end of this lengthy report, and I am well aware that an entire book could be written on this subject. I tried to condense it as much as possible in the interest of getting it out in a timely manner for those looking to potentially take advantage of these opportunities in the energy sector. I hope I did a good job of explaining the overall thesis with enough detail to get my point across without becoming overly technical, so that readers from a wide range of backgrounds can understand it.
As I said at the start of this report, I debated whether to publish it at all due to the high level of risk and uncertainty in the energy sector right now. The geopolitical situation remains highly fluid and dependent on headlines and negotiations that are inherently unpredictable.
Ultimately, however, I decided to publish it because I have been taking a much greater interest in energy lately and wanted to share my research and the opportunities I am currently watching. For full disclosure, I am currently long XLE and CF Industries and hope to enter some of the other stocks and ETFs I highlighted in this report in the future.
I am well aware that the bottom could fall out of the energy sector very quickly if there is a surprise amelioration in the U.S.-Iran war, though that is looking increasingly improbable, which is why I finally decided to dip my toes in. That said, I am prepared with an exit strategy if things do not pan out as expected. This is why I only recommend this sector for those with greater trading experience and risk tolerance, rather than mom-and-pop investors.
At the moment, I am closely watching for breakouts in both WTI and Brent crude oil, along with the energy ETFs and individual stocks I discussed throughout this report. I have strong conviction that a long-term energy supercycle lies ahead as part of a broader commodities and precious metals supercycle. The extreme uncertainty right now lies in the geopolitical situation, which adds another layer of complication when it comes to short-term timing.
I hope you enjoyed this report. I have many more interesting and detailed reports planned for this fall, in which I will explore different facets of the commodities supercycle ahead and the exciting opportunities within it, in addition to continuing my coverage of precious metals, which remain my favorite investments and the bedrock of my portfolio.
Thanks again for all of your support, which allows me to continue producing the kind of in-depth content that I am truly passionate about.
Disclaimer: the information provided in The Bubble Bubble Report and related content is for informational and educational purposes only and should not be construed as investment, financial, or trading advice. Nothing in this publication constitutes a recommendation, solicitation, or offer to buy or sell any securities, commodities, or financial instruments.
All investments carry risk, and past performance is not indicative of future results. Readers should conduct their own research and consult with a qualified financial advisor before making any investment decisions. The author and publisher disclaim any liability for financial losses or damages incurred as a result of reliance on the information provided.
If I had more money to invest I would definitely diversify into basic materials and oil related stocks, but I’m not going to sell any of my PM stocks to do so, at least that’s my thinking now.
That said, I am fascinated with the whole situation and am closely following it.
The fact that oil is now actually at an average inflation-adjusted price is another example of how spoiled everyone is and evidence of an “everything bubble”.
Similarly, people have lost touch with how extreme people can be. For example, talk of binning Iran for a few weeks to make them surrender is a joke. Just the city of London was bombed by the Germans mercilessly for over 6 months and didn’t fall. Similarly, the city of Leningrad was bombed constantly for 30 months and also didn’t surrender. Note, that these were just cities, not an entire country way larger than Texas. People ate the paste behind the wall paper in their homes in the name of mother Russia, and the leather in their clothes. You don’t think the Iranians are even more fanatical?
Hope things don’t get that crazy, but we are in a bubble.
Treasury announces upscaled buyback operation for longer-term debt, sending yields lowerhttps://www.cnbc.com/2026/08/19/treasury-announces-upscaled-buyback-operation-for-longer-term-debt-sending-yields-lower.html?__source=iosappshare%7Ccom.apple.UIKit.activity.CopyToPasteboard