These Patterns Show Gold Hitting $2,900, Silver $40 Imminently
Both gold and silver are in the process of breaking out of bull flag patterns, which indicate sharp gains in the near future. Here's what you need to know.
Gold and silver had an impressive day, with gold rising 1.18% to a record high of $2,775 and silver climbing 2.33% to close at $34.46. Today’s strong performance in precious metals has triggered a significant new bullish signal, prompting this timely update. I am trying to avoid sending too many emails, but the precious metals market is exceptionally active right now, making this information particularly relevant. I think you’ll find this update insightful and encouraging.
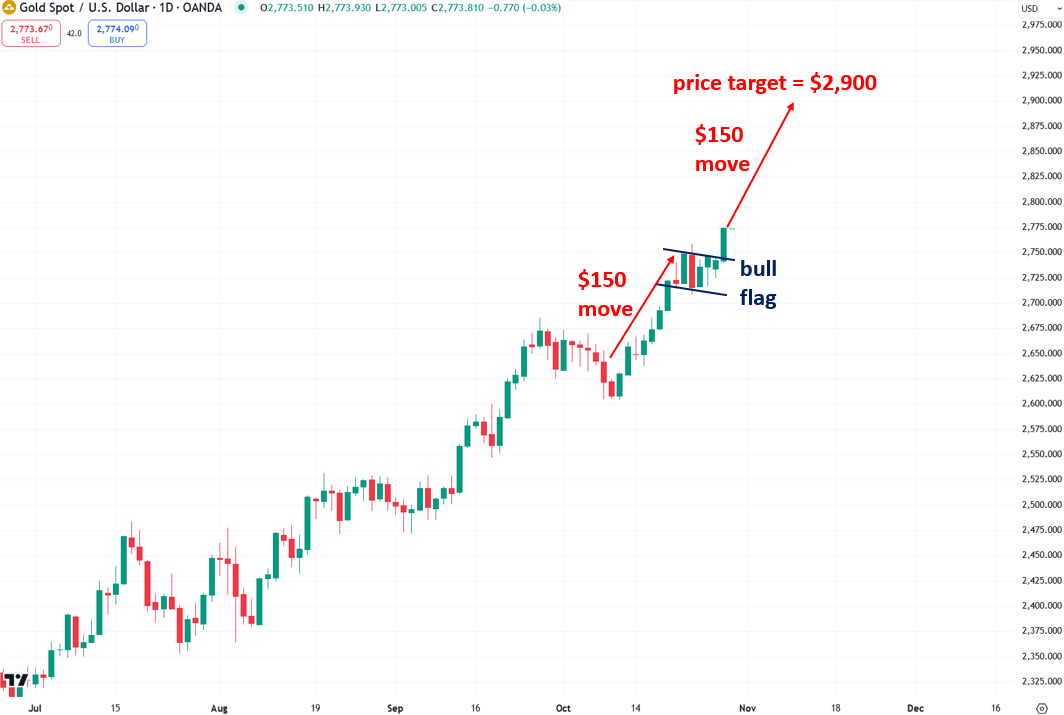
As I pointed out in my update on Sunday, gold had been forming a chart pattern known as a “bull flag,” which is a continuation pattern that suggests further gains once gold breaks out on strong volume. Following today’s strong upward move, gold has broken out of its bull flag pattern, indicating that further gains are likely ahead. Using a concept called the 'measured move,' we can project the potential price target for gold’s rise after this breakout. In a measured move, the price is expected to climb by the same number of points as the initial rally that preceded the consolidation. Applying this logic, gold should increase by an additional $150 in this leg, reaching approximately $2,900. Based on the previous move, this target may be reached within a little over a week.
Similar to gold, silver has also developed a bull flag pattern, though it hasn’t broken out yet—but I expect it will soon. The initial move into the pattern was $5, suggesting a post-breakout rally of the same magnitude, targeting approximately $40. This also makes sense because $40 is a key psychological level and such levels tend to draw prices to them like a magnet.


