


Gold and Silver Soar Amid Dollar Selloff
All the pieces are falling into place for silver’s bull market to accelerate, with a breakout into the $40s now looking increasingly likely in the near term.

Regular readers of this newsletter know that I rely heavily on intermarket analysis when evaluating the outlook for precious metals—especially the U.S. dollar, which has a well-established inverse correlation with gold, silver, and other commodities. I’ve held a bearish view on the dollar since the beginning of the year, and that thesis has played out well, helping to lift precious metals across the board—including platinum and palladium.
Today offered a textbook example of this dynamic in action. Gold jumped 1.43% and silver surged 1.98%, both driven higher by renewed dollar weakness—largely a result of falling Treasury yields. In this update, I’ll break down where gold and silver currently stand—placing special emphasis on silver, which, as I outlined in a recent in-depth report, is now firmly in the grip of a strengthening bull market.
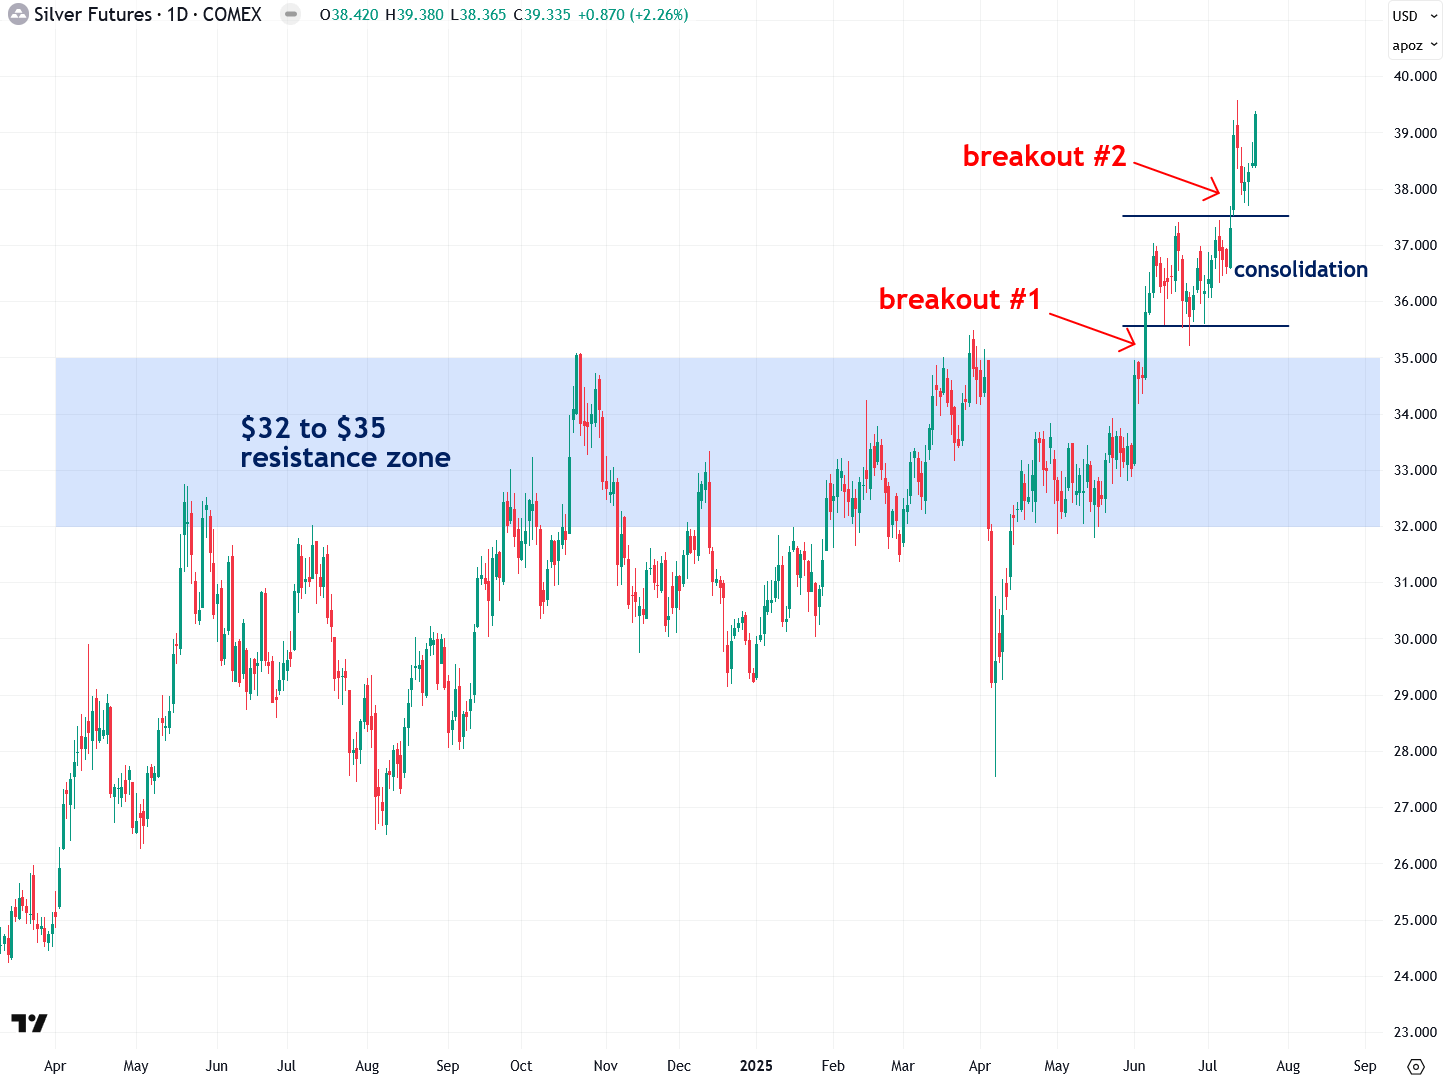
Let’s start with COMEX silver futures, which I track closely due to their tendency to respect key $1 increments—often forming well-defined support and resistance zones. Silver’s bull market truly kicked off in early June, when it finally broke above the stubborn $32–$35 resistance zone that had capped gains for over a year. I viewed that breakout as a clear signal that silver had entered a new phase—one where it’s beginning to assert itself and catch up to gold after lagging behind for much of the previous year.
After that breakout, silver consolidated for about a month before launching another strong move higher on July 11th—adding further confirmation of the emerging bull market. Today’s surge has only strengthened that case, with silver now rapidly closing in on the $40 mark.
Now let’s take a look at silver’s long-term monthly chart to identify past resistance clusters that are likely to serve as price targets during this new bull run. These resistance zones were formed during periods of price congestion, most notably during silver’s surge and peak in 2011 and 2012.