


Gold is Coiling for a Sharp Move
Key continuation patterns known as pennants are forming in both the U.S. Dollar Index and gold, and the direction of their breakouts will signal the next major move for each.

Note: I originally sent this report out last night to all subscribers, but due to a technical glitch—possibly tied to the subject line—it looks like only a fraction actually received it. I'm re-sending it now with a new subject line. If you're seeing this a second time, I apologize and appreciate your understanding.
After a volatile couple of months filled with relentless news and confusing cross-currents from the Trump administration’s tariff plans and other policies, the financial markets have calmed down in recent weeks—providing a much-needed breather for everyone, myself included. While it’s been quiet in the precious metals space, numerous indicators are flashing that this is merely the calm before the storm. As I’ll show in this update, another sharp move is likely right around the corner.
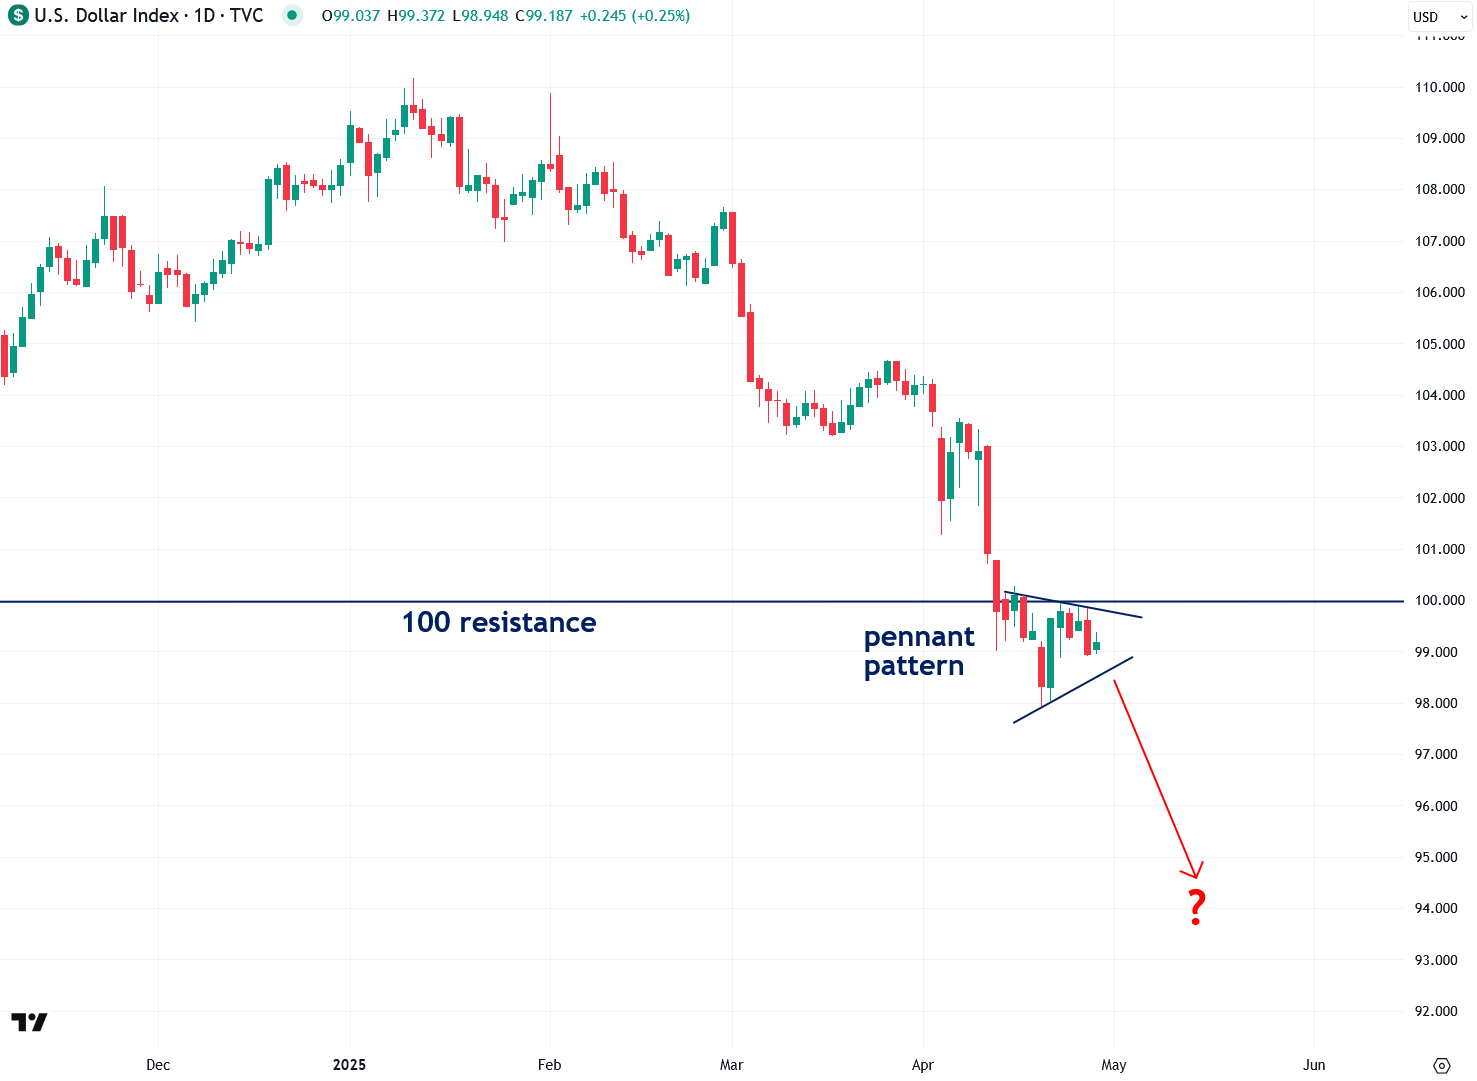
The foundation of my thesis is the U.S. Dollar Index — a measure of the dollar’s exchange rate against a basket of major world currencies (not its domestic purchasing power). As I’ve been highlighting in recent weeks (learn more), the Dollar Index is now at a critical juncture, hovering just below the key 100 level, which has served as major support and resistance for several years. Historically, rebounds off the 100 level have triggered sharp selloffs in commodities like gold and silver, due to the well-established inverse relationship between the dollar and commodity prices.
What’s especially noteworthy is that the Dollar Index recently broke below the key 100 level—a significant development that raises the likelihood of a dollar bear market (and a commodities bull market). Also worth noting is that although the dollar didn’t plunge immediately after the breakdown, it began consolidating in a pennant pattern—a technical formation that typically signals a sharp move ahead once a breakout occurs. The odds favor a downside move, as pennants are typically continuation patterns, especially with the significant 100 resistance level now looming just overhead.
My base-case scenario is that the dollar breaks down from this pattern, extending its decline. That said, I’m waiting for confirmation before making any bold calls and remain flexible to all possible outcomes.
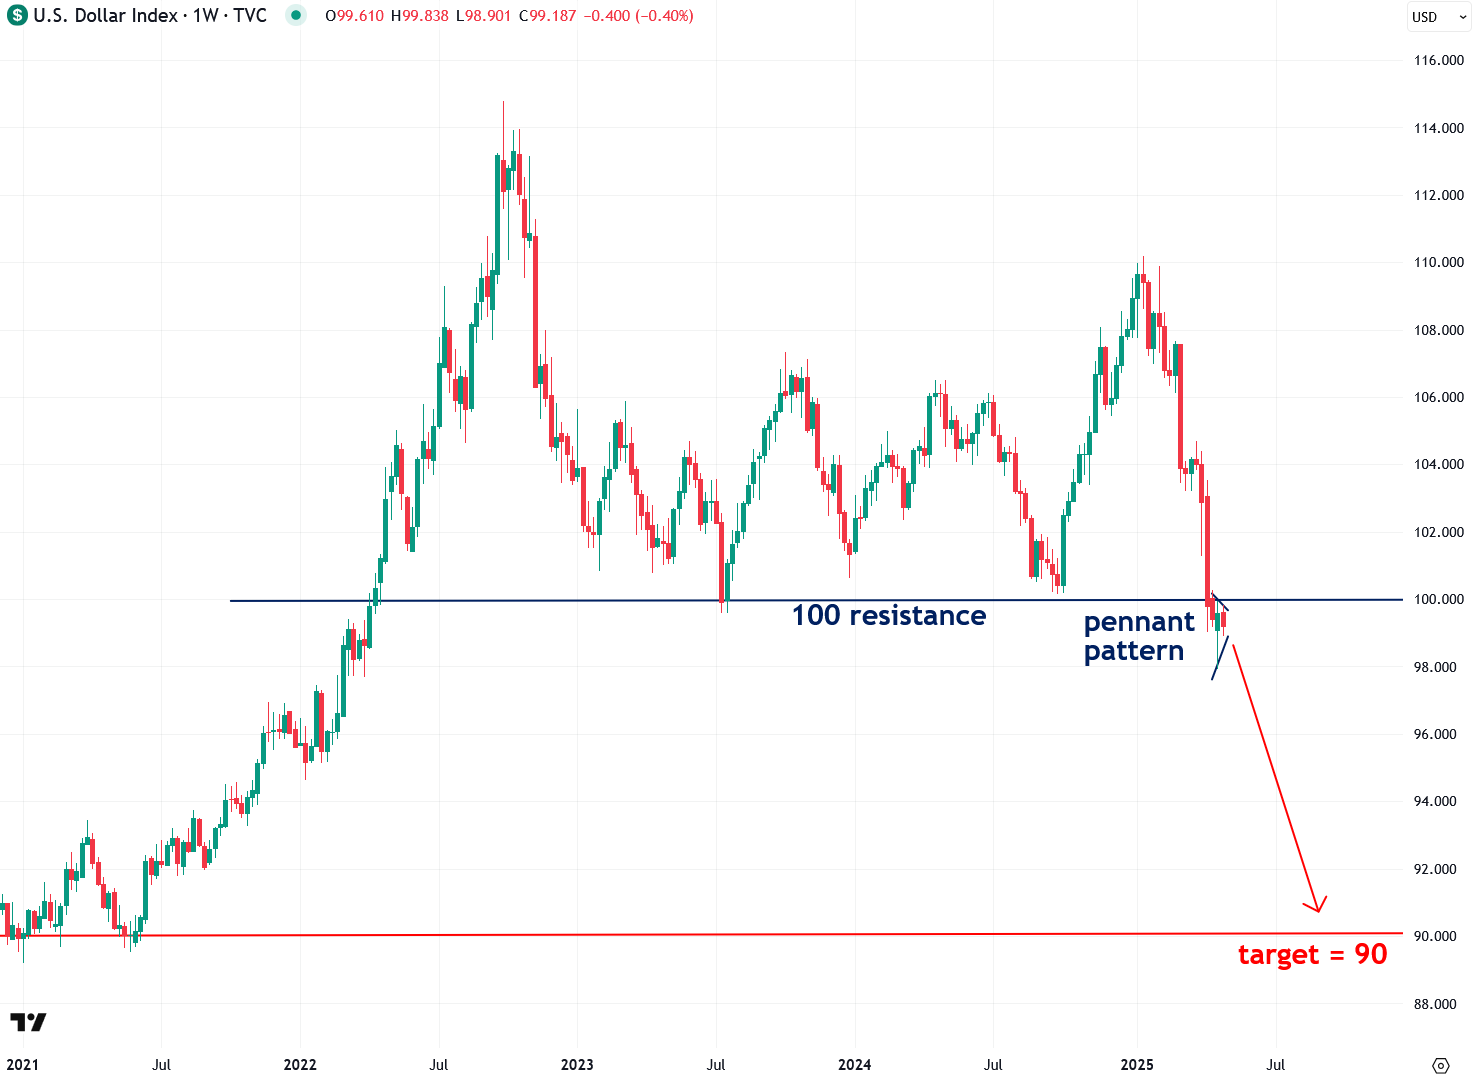
The longer-term weekly chart of the U.S. Dollar Index highlights just how important the 100 level has been in recent years. Several major rebounds have occurred off this level in the past—typically to the detriment of commodities. If the index breaks down further from here, the next key support level to watch is 90—a move that would mark a 10% decline from current levels. That’s a very realistic target, especially as we move closer to the recession and bear market I’ve been warning about.
On the flip side of the potential bearish pennant in the U.S. dollar is a possible bullish pennant forming in the euro—which makes sense, given the euro (like commodities) moves inversely to the dollar. If that pattern breaks to the upside, it would signal further appreciation in both the euro and commodities.
As I explained last week, the euro has finally broken above a 16-year downtrend line against the U.S. dollar—a signal that a major shift is underway. This breakout indicates the euro may be entering a new bull market after nearly two decades of weakness, which in turn strengthens the bearish case for the dollar given their inverse relationship.