


Here's Where the Stock Market Stands Right Now
The stock market has bounced over the past week, but the move isn't convincing due to weak volume and the fact that it's been largely driven by retail investors.

After a sharp selloff that began in mid-February, stocks finally staged a bounce over the past week—as I had anticipated. Even in the fiercest bear markets, declines are never in a straight line. This recent rebound was fueled in part by better-than-expected economic data and a dovish tone from the Fed, which held rates steady and announced a slowdown in the pace of its balance sheet runoff. However, while the market has recovered from deeply oversold levels, there are valid reasons to question the sustainability of this bounce. The rally lacked conviction, occurred on weak volume, and was driven more by retail traders than institutional investors.
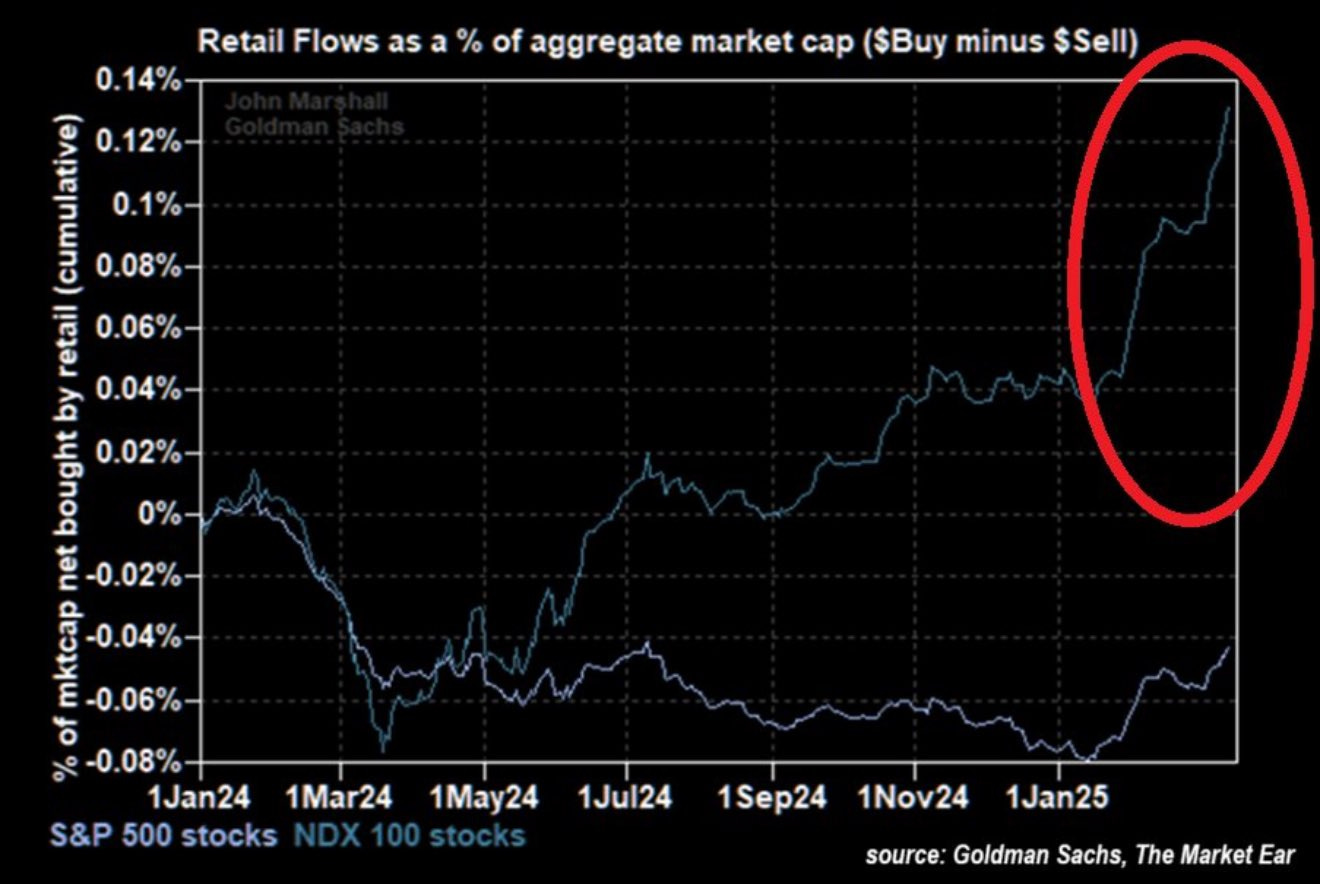
In recent years and months, retail investors—often labeled the “dumb money” due to their tendency to be on the wrong side of major market turning points—have remained extremely bullish, especially on high-flying tech stocks like Nvidia, Tesla, and Apple. Whenever the market pulls back, they tend to rush in and buy aggressively, assuming the market will inevitably rebound. So far, that approach has worked—but it won’t always. As I outlined in this report, the stock market is in the midst of a massive bubble, one that’s poised to burst in spectacular fashion.
Anyway, as you can see from the chart below, retail investors have been aggressively buying this dip in recent weeks—and in my view, they’re making a major mistake:
Now let’s dive into the technicals, starting with the bellwether S&P 500. From December through February, the index formed a clear triple top pattern before breaking decisively below the key 5,800–6,000 support zone—issuing a bearish signal. Despite last week’s rebound, the S&P 500 remains below that critical area, which has now turned into resistance—a concerning development for the broader market outlook.
Adding to the caution is the light volume behind the recent bounce, which shows a lack of conviction among buyers. Right now, the chart appears to show a market that is rolling over. Unless the S&P 500 can reclaim and hold above the 5,800–6,000 zone, the technical outlook remains bearish, and the risk continues to lean to the downside.

The tech-heavy Nasdaq 100 recently broke below the critical 20,750–21,000 support zone I’ve been closely watching, confirming a significant technical breakdown. Despite last week’s weak rebound, nothing meaningful has changed. At this stage, there are no clear or substantial support levels in sight, suggesting that the path of least resistance remains to the downside—for now.