


Why the U.S. Stock Market Bubble Is on Shaky Ground
With the stock market more overvalued than during the dot-com bubble and smart money exiting, the risks have never been more significant.

Although economic and stock market optimism surged after Donald Trump’s victory in the U.S. presidential election last November, it never translated into sustained market gains. This has led me to question whether the stock market is reaching a peak—historically, markets often top out on good news before bad news follows. Over the past week, a wave of negative developments has triggered a sharp selloff across the U.S. stock market. In this report, I will examine where the market stands and whether an even steeper decline could be on the horizon.
Although the holiday-shortened week started strong, with the S&P 500 hitting an all-time high on Wednesday, a wave of bad news quickly reversed momentum. Over the next couple of days, markets sank sharply, culminating in a steep selloff on Friday. The S&P 500 tumbled 107.5 points (-1.75%), while the Dow sank 748.63 points (-1.69%) in a single session, erasing nearly $1 trillion in market capitalization on Friday alone.
The downturn began on Wednesday when big data analytics firm Palantir (PLTR)—a favorite among investors—tumbled 10% after reports emerged that the Trump administration plans to slash defense spending, a major source of Palantir’s revenue. This set the stage for broader market weakness.
On Thursday, Walmart (WMT) plummeted 6.53% after warning that its sales and profit growth would slow this year. Given that Walmart is the largest retailer in the U.S., its struggles raised concerns about consumer spending and the financial health of working-class Americans. The warning spooked investors and contributed to the market’s downward slide.
By Friday, selling pressure intensified. UnitedHealth Group (UNH) plunged 7.17% following reports that the U.S. Department of Justice (DOJ) has launched an investigation into its Medicare billing practices. Meanwhile, the University of Michigan consumer sentiment index fell to 64.7 in February, a nearly 10% drop, exceeding expectations. The decline signaled growing consumer fears about inflation, particularly with the prospect of new tariffs.
This aligns with my growing concerns that the U.S. economy is heading toward stagflation—a period of sluggish growth or recession combined with persistent inflation. Adding to the uncertainty, billionaire investor Steve Cohen warned that Trump’s tariffs and DOGE budget cuts could negatively impact the economy, potentially triggering a significant market correction.
Further unsettling investors, researchers in China reported the discovery of a COVID-like bat virus in the same laboratory previously accused of leaking the virus responsible for the 2020 outbreak. On the global stage, the surging Japanese yen raised alarms about the potential for another carry trade unwind, similar to what happened in July and August—a scenario I will analyze in more detail shortly.
Let’s move on to the technicals, starting with the bellwether S&P 500. The index has made three distinct attempts to reach all-time highs, only to be sharply rejected each time—a clear sign of weakness and potential topping action. Adding to the concern is a bearish divergence in the Relative Strength Index (RSI), a widely used momentum indicator that helps confirm price action. In this case, the RSI is failing to validate the S&P 500’s upward climb over the past few months, signaling a loss of momentum. To fully confirm that a correction is underway, I am watching for a decisive close below the 5,800 to 6,000 support zone.

Similarly, the tech-heavy Nasdaq 100—led by its dominant Magnificent 7 components (Alphabet, Amazon, Apple, Meta, Microsoft, NVIDIA, and Tesla)—has struggled to gain traction in recent months. Given its outsized influence on the broader market, a decisive close below the 20,750 to 21,000 support zone would strongly signal that a steeper downturn is likely underway.

The high-flying Magnificent 7 ETF (MAGS) has stalled since mid-December, pulling back after its rapid ascent. I closely track this ETF because it serves as a key bellwether for both tech stocks and the broader U.S. stock market. The first major support level to watch is $53—if that breaks, the next critical level is $50. A decisive move below $50 would likely signal a more significant correction, not just for the Magnificent 7, but for the overall market as well.

The Dow Jones Industrial Average (DJIA) appears to have formed a double top pattern, a classic bearish reversal signal. Confirmation of this pattern requires a decisive close below the 41,600 to 42,000 support zone. If that level breaks, it would strongly suggest that a steeper market correction is likely ahead.

The small-cap Russell 2000 index, which derives a larger share of its earnings from the domestic U.S. economy, has been struggling after its brief Trump-induced surge in November. As libertarian economist Peter Schiff noted, the index’s recent weakness suggests that the “Trump trade” is unraveling. The next key level to watch is the 2,175 to 2,200 support zone—a decisive close below this range would strongly signal the potential for a deeper downturn ahead.

The CBOE Volatility Index (VIX), often considered to be the stock market’s “fear gauge,” has remained unusually low for much of the past year, reflecting strong investor optimism. However, a concerning development is the formation of a triangle pattern on the index. A bullish breakout from this pattern would indicate a surge in fear and a sharp downturn in U.S. stock indices—and it appears that this move may have already begun on Friday. This is a critical development worth watching closely.

Another key index to watch is homebuilding stocks, as tracked by the SPDR Homebuilders ETF (XHB). The housing market serves as a bellwether for the U.S. economy, often leading both recessions and recoveries. Currently, homebuilder stocks are rolling over, driven by extreme housing unaffordability, which has pushed 2024 home sales to their lowest levels since 1995 for the second year in a row. I expect a major downturn as inflated housing prices inevitably correct. A decisive close below the $96 to $100 support zone would signal that a deeper bear market in housing and homebuilder stocks is unfolding—one that will drag down the broader U.S. economy along with it.

As I mentioned earlier in this report, another major factor behind last week’s selloff in stocks and other risk assets was the sharp rally in the Japanese yen, which is raising concerns of another yen carry trade unwind—similar to the market turmoil seen in July and August of last year.
The yen surged following a report that Japan’s headline inflation rate hit 4% in January, a two-year high for a country long associated with persistent deflation. This spike increases the likelihood of further rate hikes by the Bank of Japan, which in turn is bullish for the yen. However, a strengthening yen poses a serious risk to global financial markets, as it threatens to unwind the global carry trade, in which an estimated $4 trillion was borrowed at ultra-low Japanese interest rates and invested largely in high-flying U.S. risk assets, which have surged amid the broader stock market bubble.
The problem is that as the yen rises, the cost of repaying these loans increases, forcing investors who have engaged in the yen carry trade to deleverage by selling risk assets. This selling pressure, in turn, drives the yen even higher, triggering a self-reinforcing cycle of liquidation that destabilizes markets. It will be crucial to monitor the yen’s movement in the coming days, as further appreciation will intensify market volatility and deepen the ongoing selloff.

The Nikkei 225, Japan’s benchmark stock index, illustrates the market turmoil triggered by the early stages of the yen carry trade unwind last July. During that period, the index sold off sharply, sparking a ripple effect that spread to global stocks and other risk assets. While the Bank of Japan managed to calm the markets temporarily, kicking the can down the road, the underlying issue remains unresolved. To confirm that a similar episode is unfolding, I am closely watching for a decisive close below the 37,000 to 38,000 support zone, which would signal a renewed phase of market turmoil.

Bitcoin is a key indicator for gauging investor appetite for risk assets, including stocks. As I recently explained, Bitcoin is highly correlated with the tech-heavy Nasdaq 100 index, often mirroring its movements. While Bitcoin surged following the election, it has since struggled to maintain momentum, disappointing investors who anticipated an even stronger rally.
In addition, the RSI momentum indicator shows a concerning bearish divergence that is indicative of underlying weakness. Currently, Bitcoin is holding above the critical 90,000 to 92,500 support zone. A decisive close below this level would be bearish for Bitcoin and could also signal further weakness in the stock market.

XRP, one of the most popular cryptocurrencies, surged immediately after the U.S. presidential election but has since stalled, serving as a key indicator of investor risk appetite. Currently, XRP is holding above the $2 to $2.20 support zone, but a break below this level would suggest that not only XRP but the broader cryptocurrency market is headed for a deeper decline. Such a move would likely coincide with a broader selloff in high-flying tech stocks, reinforcing the risk-off sentiment across speculative assets.

As we move into the realm of increasingly speculative cryptocurrencies, let’s take a look at Dogecoin, which, like many other cryptos, surged after the election only to give up its gains, signaling a cooldown in sentiment across the crypto space. This shift is bullish for gold and silver, as cryptocurrencies and precious metals typically compete for investor capital.
As a reminder, I view cryptocurrencies as distractions from true sound money—gold and silver. Unlike precious metals, which have stood the test of time, cryptos are poor stores of value that I believe will ultimately fail as long-term wealth preservation assets, as I discussed in a recent report.

Finally, we turn to one of the most outrageous examples of crypto speculation—Fartcoin. This token skyrocketed after the election, fueling a speculative frenzy that diverted attention (and capital) away from time-tested assets like gold and silver. However, as the crypto bubble deflates, Fartcoin has already given up much of its gains, and I believe there’s still plenty of downside ahead.

Next, we turn to MicroStrategy (MSTR), a company effectively functioning as a leveraged Bitcoin holding vehicle, led by Bitcoin evangelist Michael Saylor. MicroStrategy currently holds 478,740 bitcoins, valued at approximately $46 billion, and continues to use debt financing to acquire more Bitcoin. This strategy amplifies its exposure, making the stock highly volatile—magnifying gains when Bitcoin rises but also deepening losses when it falls.
In my recent report, I described MicroStrategy as essentially a Ponzi scheme, and its stock has become a favorite among crypto and tech stock enthusiasts—many of whom are young, inexperienced, and have never experienced a recession or prolonged bear market. Because of this, MSTR serves as a key indicator of speculative sentiment in both the crypto and tech sectors.
While MicroStrategy surged after the election, it has since plunged nearly 50%, and I believe it has much further to fall once investors begin to wisen up. The critical support zone I’m watching is $280 to $300—a decisive close below this level would likely signal further downside, not just for MSTR, but for the broader crypto market and even the tech stock space.
The stock market is especially vulnerable right now, primarily due to historically record levels of investor optimism. Sentiment is at its most bullish in decades, which means that much of the potential upside is already priced in. As a result, the market has become highly vulnerable to negative developments, as evidenced by the sharp selloff this past week. This excessive complacency leaves stocks exposed to further downside risk should unfavorable developments continue to emerge.
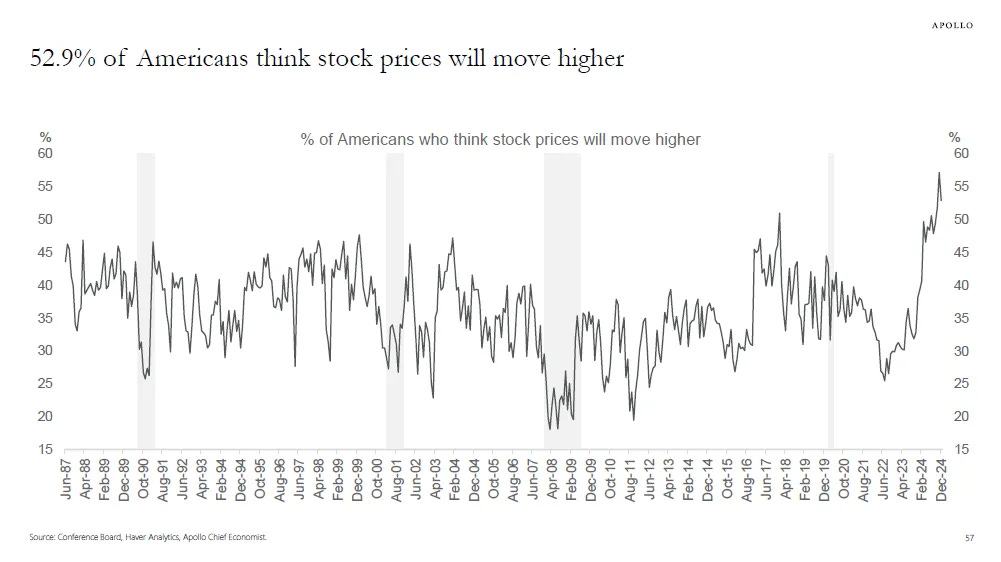
According to the Conference Board survey, an astonishing 52.9% of Americans—an even higher percentage than during the dot-com bubble—believe stock prices will rise over the next twelve months. From a contrarian perspective, this is deeply concerning. Extreme bullishness among retail investors is a hallmark of a market bubble and typically precedes a major peak, followed by a sharp downturn or bear market.
Another key indicator, the Euphoriameter, confirms that investor bullishness is at unprecedented levels, surpassing even the exuberance seen during the dot-com bubble, which ended in a devastating bear market:

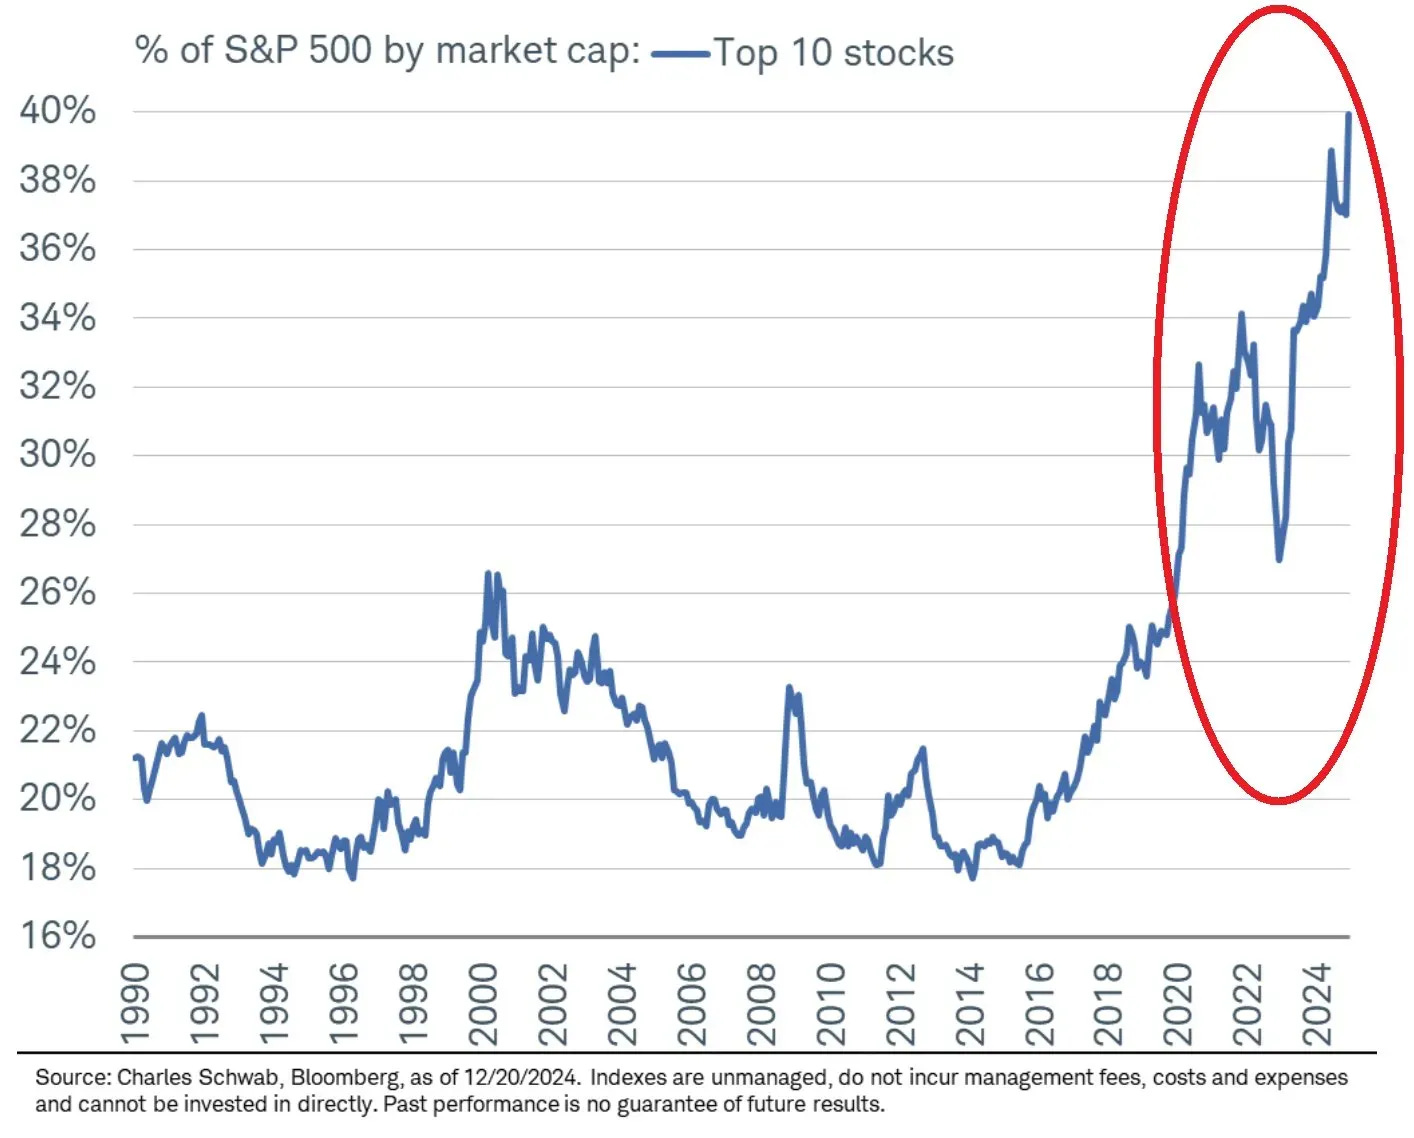
The current stock market bubble is marked by an extreme concentration of market capitalization in the top 10 stocks, largely driven by the high-flying "Magnificent Seven" mentioned earlier. This narrow leadership indicates that the market boom is not broad-based, making it particularly vulnerable to a downturn when these dominant stocks eventually falter. A similar phenomenon occurred with the "Nifty Fifty" stocks of the 1960s and 1970s, which enjoyed immense popularity before sinking in the 1970s, leading to a prolonged period of stagnation for the broader market until the early 1980s.
The "Buffett Indicator", or the total U.S. stock market capitalization-to-GDP ratio, is a valuable tool for assessing whether the stock market is in bubble territory. This metric is named after the billionaire investor Warren Buffett, who has called it "the best single measure of where valuations stand at any given moment."
Currently, the Buffett Indicator stands at a staggering 206, which is 142% above its long-term average of 85, dating back to 1971. This level is even higher than the peak of the late-1990s dot-com bubble, which ended in a devastating crash. Buffett himself warned that when the ratio approaches 200%, investors are "playing with fire." The reason for this extreme valuation is that the stock market has surged far beyond the growth of the actual economy, a classic hallmark of speculative excess.
History has shown that valuations eventually revert to the mean, making the market highly vulnerable to a sharp and violent downturn. Given the current extremes, the risk of a significant bear market is not a matter of if, but when.

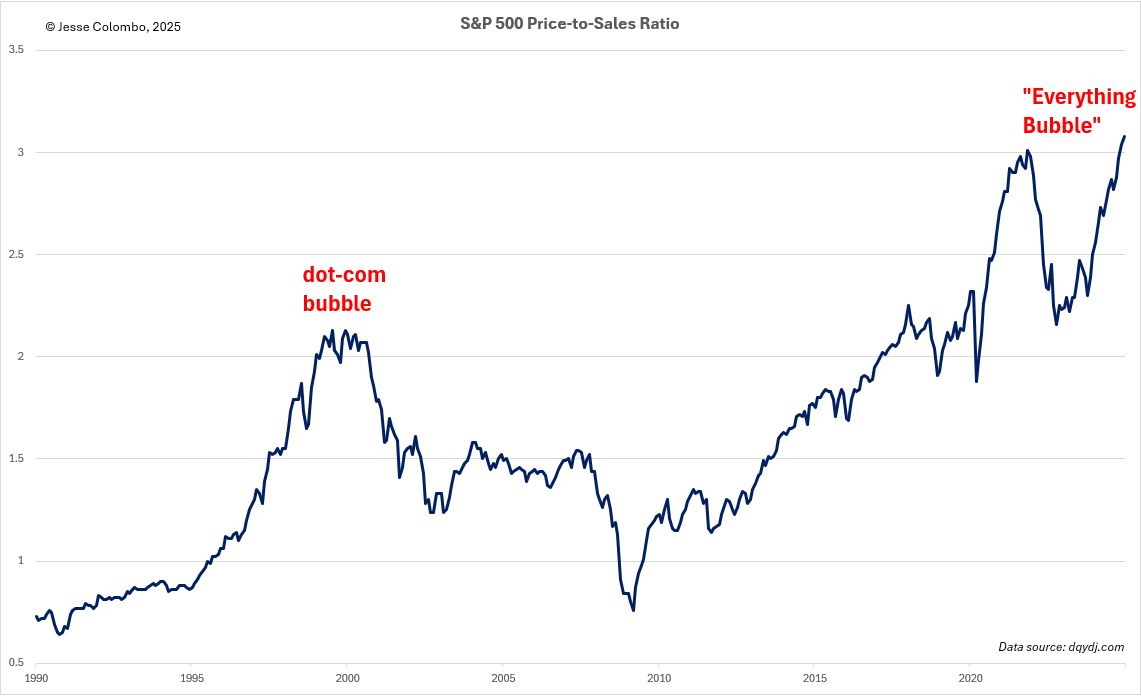
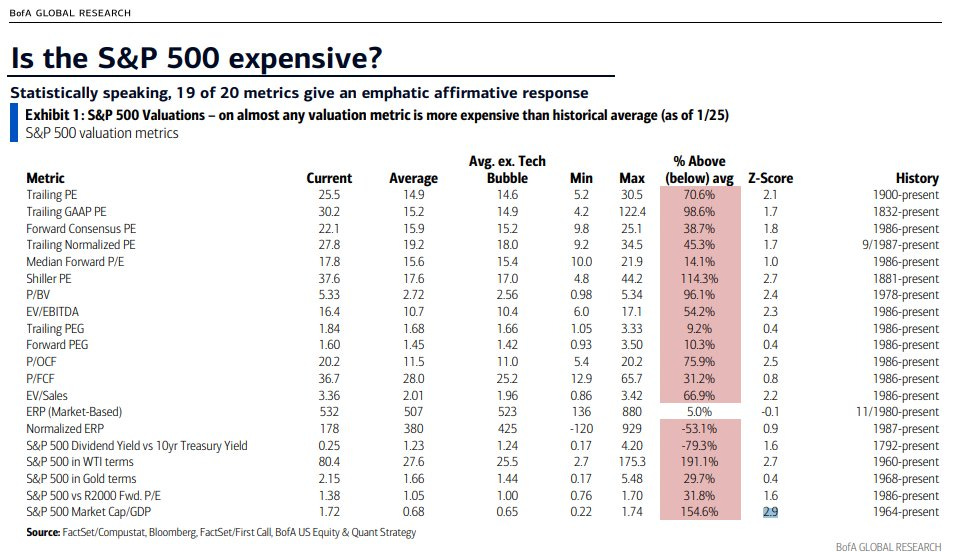
Many other indicators also confirm the extreme overvaluation of the U.S. stock market including the S&P 500's price-to-sales ratio, which currently sits nearly 50% higher than its peak during the dot-com bubble. This implies that stocks are trading at historically unsustainable levels, further reinforcing the risk of a catastrophic bear market.
If you're still not convinced that stocks are in a massive bubble, consider the Nasdaq 100 adjusted for the U.S. M2 money supply. This metric shows that tech stocks have outpaced the growth of the money supply, a pattern eerily similar to what occurred during the dot-com bubble. When asset prices rise faster than liquidity expansion, it signals unsustainable speculation, further reinforcing the risks of a looming bear market.

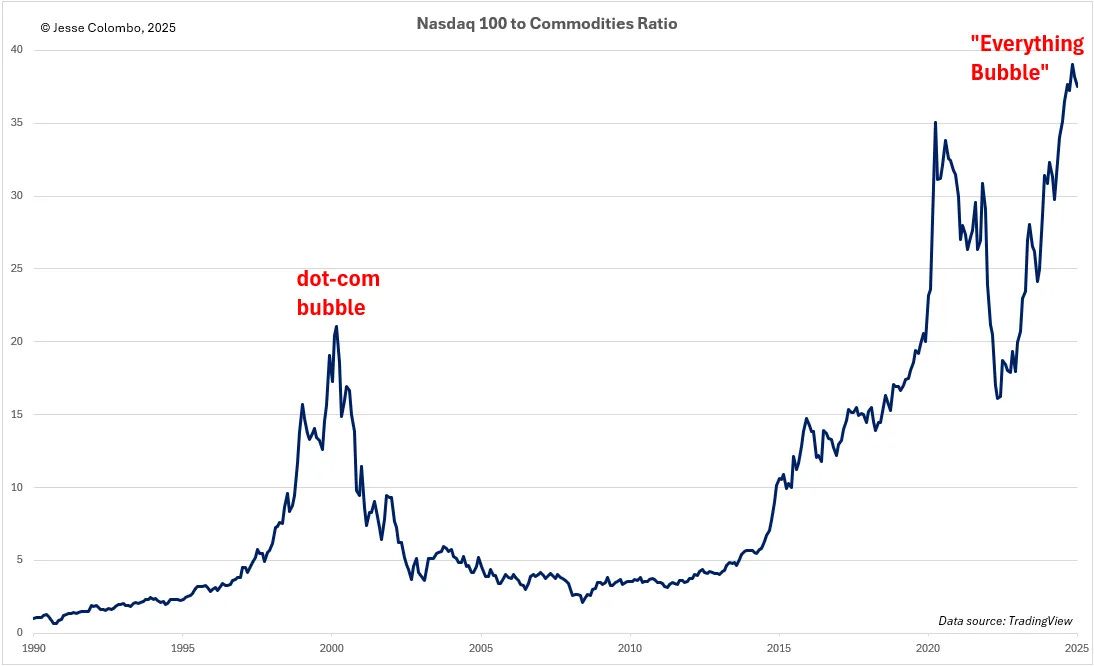
Additionally, the ratio of the Nasdaq 100 to the S&P GSCI Commodity Index underscores how tech stocks have dramatically outperformed commodities, closely mirroring the trend seen during the dot-com bubble—except this time, the disparity is even more extreme:
While I’ve already highlighted several valuation metrics that clearly demonstrate the extreme overvaluation of the U.S. stock market, there's plenty more to consider. In fact, 19 out of 20 key valuation metrics confirm that the S&P 500 is wildly overvalued and dangerously exposed to a violent unwinding of the excesses that have accumulated over the past 16 years.
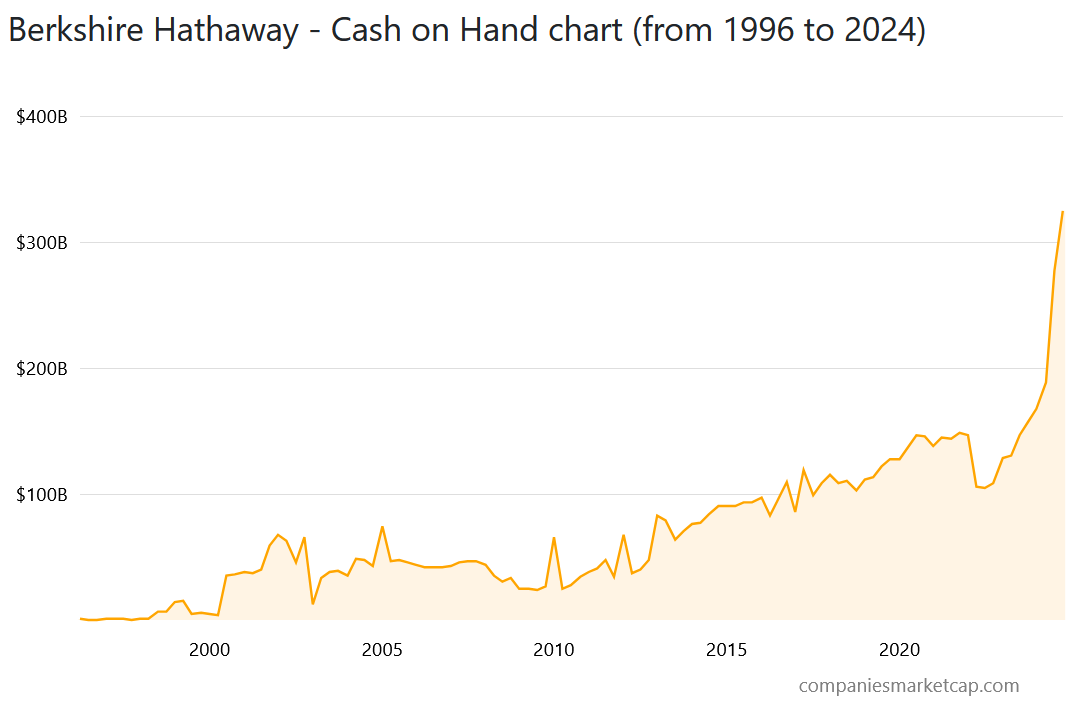
As previously discussed, Warren Buffett is an extremely savvy investor who understands the importance of tracking market valuations and managing risk when stocks become excessively expensive—just as they are now. True to form, Berkshire Hathaway has significantly boosted its cash reserves in recent quarters, reaching an astounding $334 billion.
This strategic move is particularly wise given the market’s extreme overvaluation, as it provides protection against the coming downturn while also positioning Berkshire with substantial dry powder to scoop up undervalued assets once the anticipated bear market unfolds.
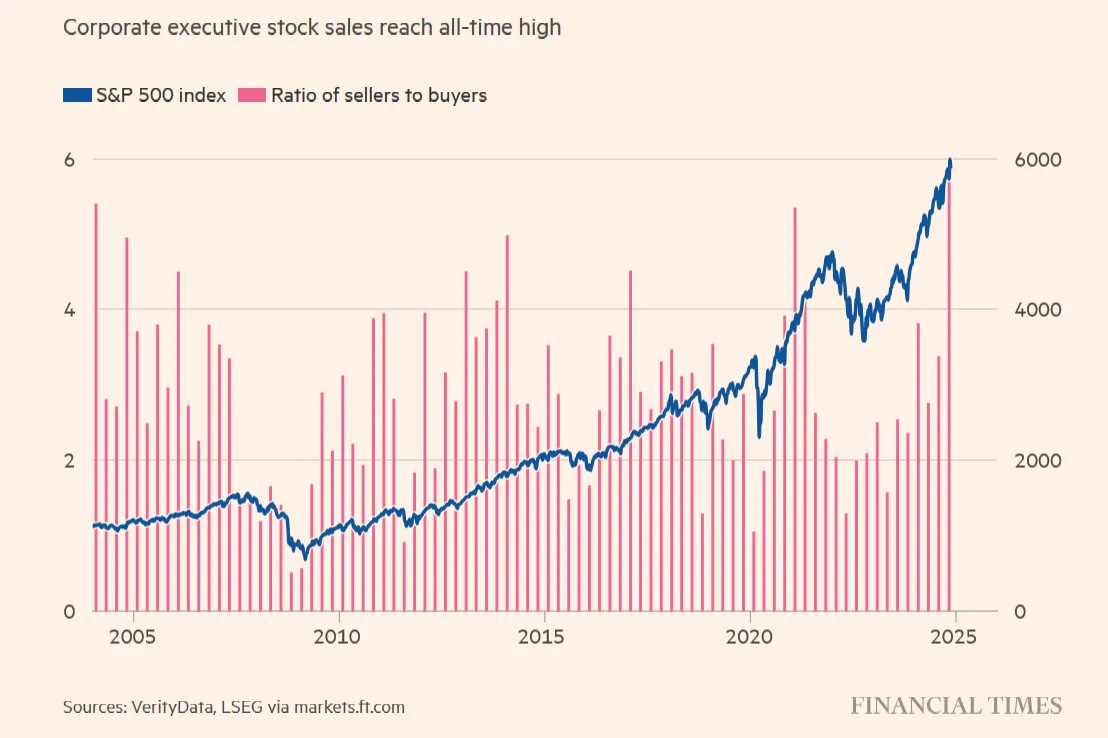
Additionally, corporate insiders—who likely sense an impending downturn—have been selling shares at a record pace in recent months. Among them is JPMorgan Chase CEO Jamie Dimon, who made headlines last week after unloading a staggering $233.77 million worth of his shares.
While the “smart money”—including Warren Buffett and corporate insiders—is aggressively selling stocks, retail investors are doing the opposite, stuffed to the gills with overpriced equities. Their stock allocation has soared to 43.38% of total assets, the highest on record, signaling a disaster in the making. This overexposure is especially dangerous given extreme stock valuations and a rapidly aging investor population, many of whom won't have time to recover from a devastating bear market. With retail investors all-in on the market bubble, significant financial pain is inevitable when reality sets in.

One of the key reasons stocks have been struggling lately is the rise in inflation expectations, driven in part—but not entirely—by the Trump administration’s upcoming tariffs. A closely watched gauge of inflation expectations, the 5-year breakeven inflation rate, has surged significantly since early September. This, combined with a slowing economy and rising layoffs, is increasingly pointing toward a stagflationary scenario, which is bearish for stocks but highly bullish for gold, silver, and their mining stocks—a trend I recently highlighted.

Another key indicator pointing to the risk of stagflation is the New York Fed Recession Probability Model, which estimates the likelihood of a recession within the next 12 months. Historically, when this indicator rises, the probability of a recession increases. However, when it begins to decline, it often signals that the economy is already in a recession. Over the past year, this model has turned downward, strongly suggesting that the U.S. economy has likely already entered a recession—a troubling confirmation of worsening economic conditions.

While stocks and their investors face significant risk due to the massive stock market bubble ahead of a likely recession—a lethal combination—this is actually very bullish for the precious metals sector. A powerful capital rotation from overinflated stocks to undervalued gold and silver appears to be on the horizon.
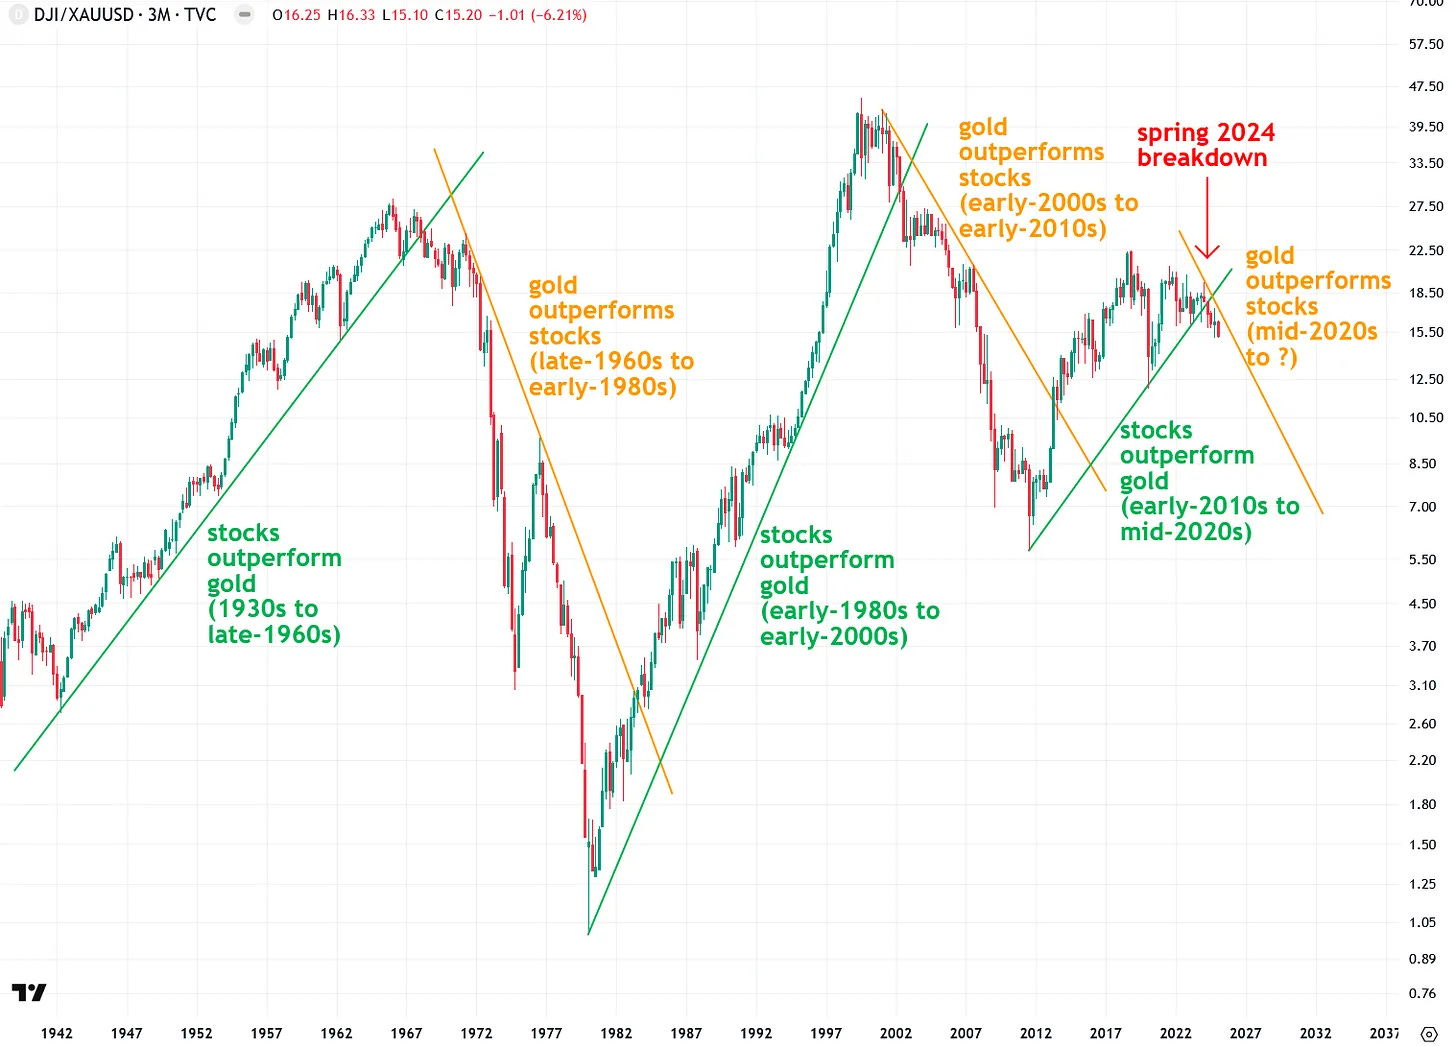
As illustrated by the Dow-to-Gold ratio chart, these capital rotation events occur periodically and are signaled by breaks of major trendlines. A break below an uptrend line signals that gold is poised to outperform stocks, while a break above a downtrend line indicates the opposite. Historically, major secular bull markets in both gold and equities over the past century have been preceded by such trendline breaks.
What’s particularly significant is that in spring 2024, the Dow-to-Gold ratio broke below its uptrend line. This means that a capital rotation from stocks to gold is already underway—and when the current stock market bubble inevitably bursts, this rotation will only accelerate.
Many gold, silver, and mining stock investors who have been around long enough remain skittish, recalling how these assets plunged alongside the broader market during the 2008 credit crisis. However, I want to emphasize that a repeat of that scenario is not inevitable this time around for several key reasons.
By 2008, gold had already tripled in value, silver had soared more than fourfold, and mining stocks had skyrocketed over tenfold in the prior seven years, making them overextended and vulnerable to a pullback. That situation is very different from today, where gold, silver, and mining stocks—especially silver and miners—remain deeply undervalued and have yet to experience a sustained bull market. Unlike 2008, they aren’t inflated by any means, meaning they are far less vulnerable to a major correction.
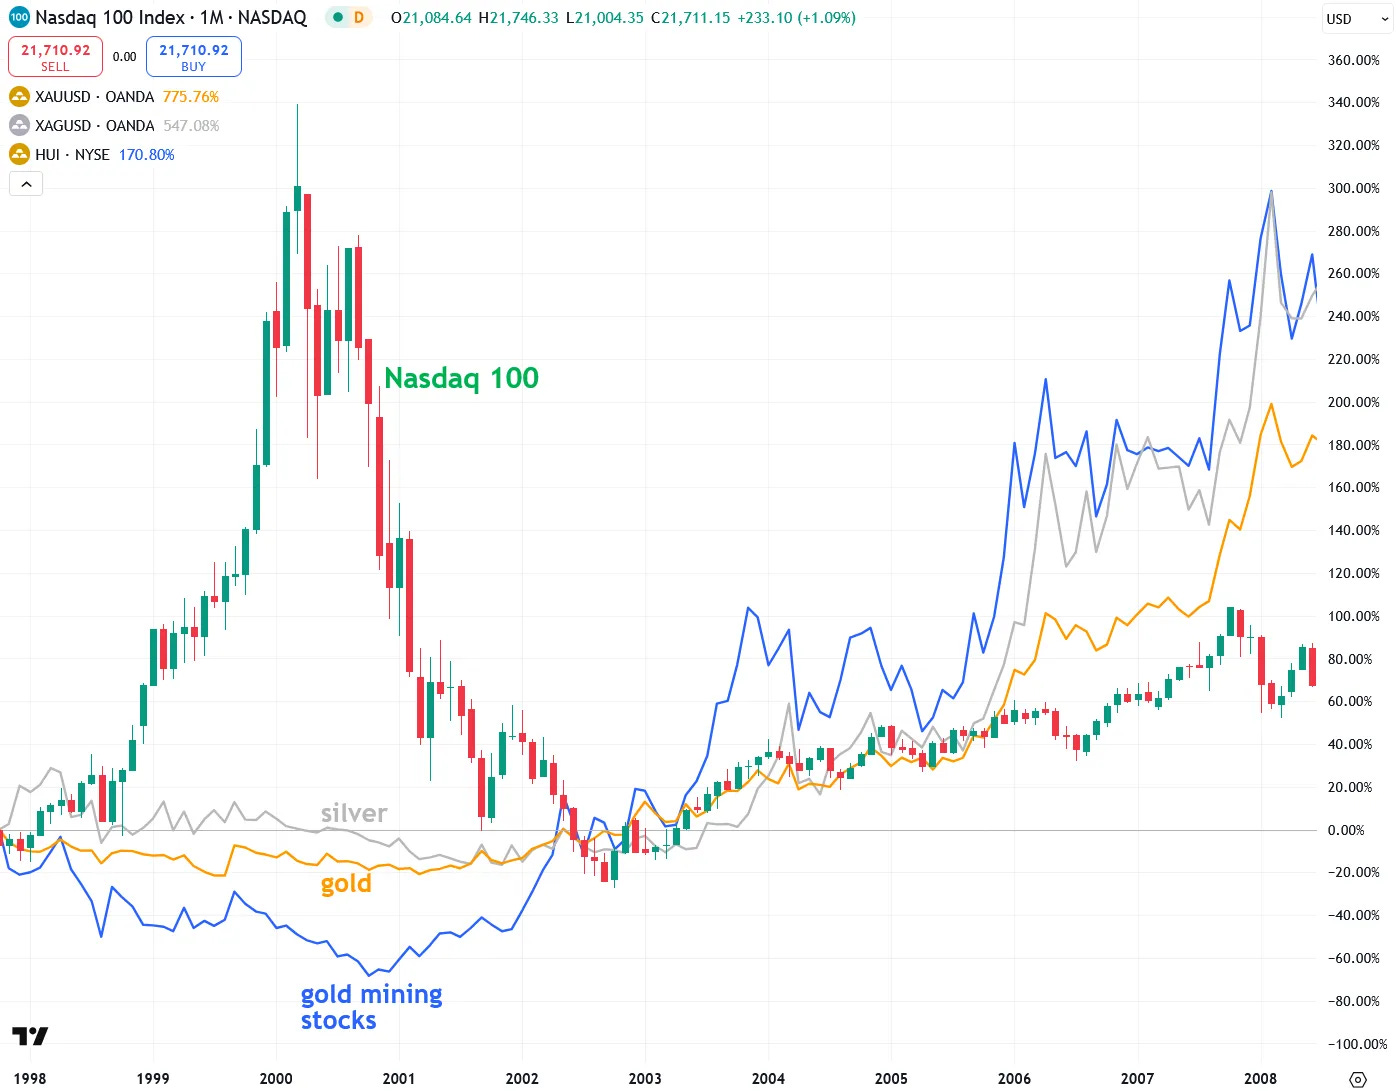
A more relevant historical comparison is the 2000–2002 bear market, when the dot-com bubble collapsed. That period turned out to be extremely bullish for gold, silver, and mining stocks, as capital rotated out of crashing tech stocks and into undervalued precious metals, fueling a massive rally. Given that today’s market environment mirrors the 1999 tech bubble more than 2008, I see the 2000–2002 scenario as a better historical parallel—one that suggests a bullish outlook for gold, silver, and miners once the current tech bubble bursts.
In summary, the U.S. stock market is in an extreme and unprecedented bubble, even more inflated than the dot-com bubble. While the majority of retail investors remain blinded by optimism, believing the market will continue to rise, smart money investors—including Warren Buffett and corporate insiders—are focusing on downside risk rather than upside potential.
Throughout this report, I’ve outlined key scenarios that will signal whether a major market breakdown is imminent, making it critical to watch these developments closely.
Meanwhile, precious metals have already rallied over the past year, but with the stock market still deep in bubble territory, the strongest phase of the precious metals bull market has yet to begin. This presents an exciting opportunity for those positioned in gold, silver, and mining stocks, as the inevitable capital rotation away from stocks is likely to drive massive gains in this space.
Kind regards,
Jesse Colombo
Precious metals analyst and investor. Advocate for free markets and sound money. Recognized by the London Times for predicting the 2008 Global Financial Crisis.
Disclaimer: the information provided in The Bubble Bubble Report and related content is for informational and educational purposes only and should not be construed as investment, financial, or trading advice. Nothing in this publication constitutes a recommendation, solicitation, or offer to buy or sell any securities, commodities, or financial instruments.
All investments carry risk, and past performance is not indicative of future results. Readers should conduct their own research and consult with a qualified financial advisor before making any investment decisions. The author and publisher disclaim any liability for financial losses or damages incurred as a result of reliance on the information provided.
Thanks again Jesse, an excellent comprehensive analysis of the market.
In my view, there are so many set ups for a Black Swan to come along, as with previous tops, we should be positioned accordingly, Long Gold and Silver, an appropriate percentage Short the Index's.
I'm really looking forward to the inevitable correction back to the Mean, for me,hopefully, the Monthly 100 EMA.
The coming months should really shake up those Manipulating Market Makers that have put a ceiling on Silver.
We could have a bloodbath on Monday if the Asian trading suggests that ‘Covid 2.0’ is being taken ‘seriously’