


The Markets Are Turning Ugly Fast
Risk assets continued their decline on Thursday, breaking below key technical levels and signaling further weakness ahead.

On Sunday, I published a comprehensive report explaining why I believed the bubble in high-flying risk assets—particularly stocks and cryptocurrencies—was nearing its end, and on Tuesday, as markets continued to slide, I provided an update highlighting the ongoing breakdown. I highly recommend reading those reports for valuable insights, charts, and data that help make sense of the situation. Market conditions are worsening rapidly, and my concerns are growing, so I’m publishing this latest update to show you exactly where things stand now.
On Thursday, the U.S. stock market tumbled, with the S&P 500 dropping 1.58% and the Nasdaq 100 plunging 2.74%, driven by a mix of factors. Nvidia sank 8.48% following its earnings report, while concerns mounted over President Donald Trump’s plans to impose tariffs on Canada, Mexico, China, and the European Union. Additionally, higher-than-expected jobless claims of 242,000 and a lackluster GDP report showing 2.3% growth last quarter added to the pressure. I also believe the markets are beginning to price in the recession I’ve been warning about since December.
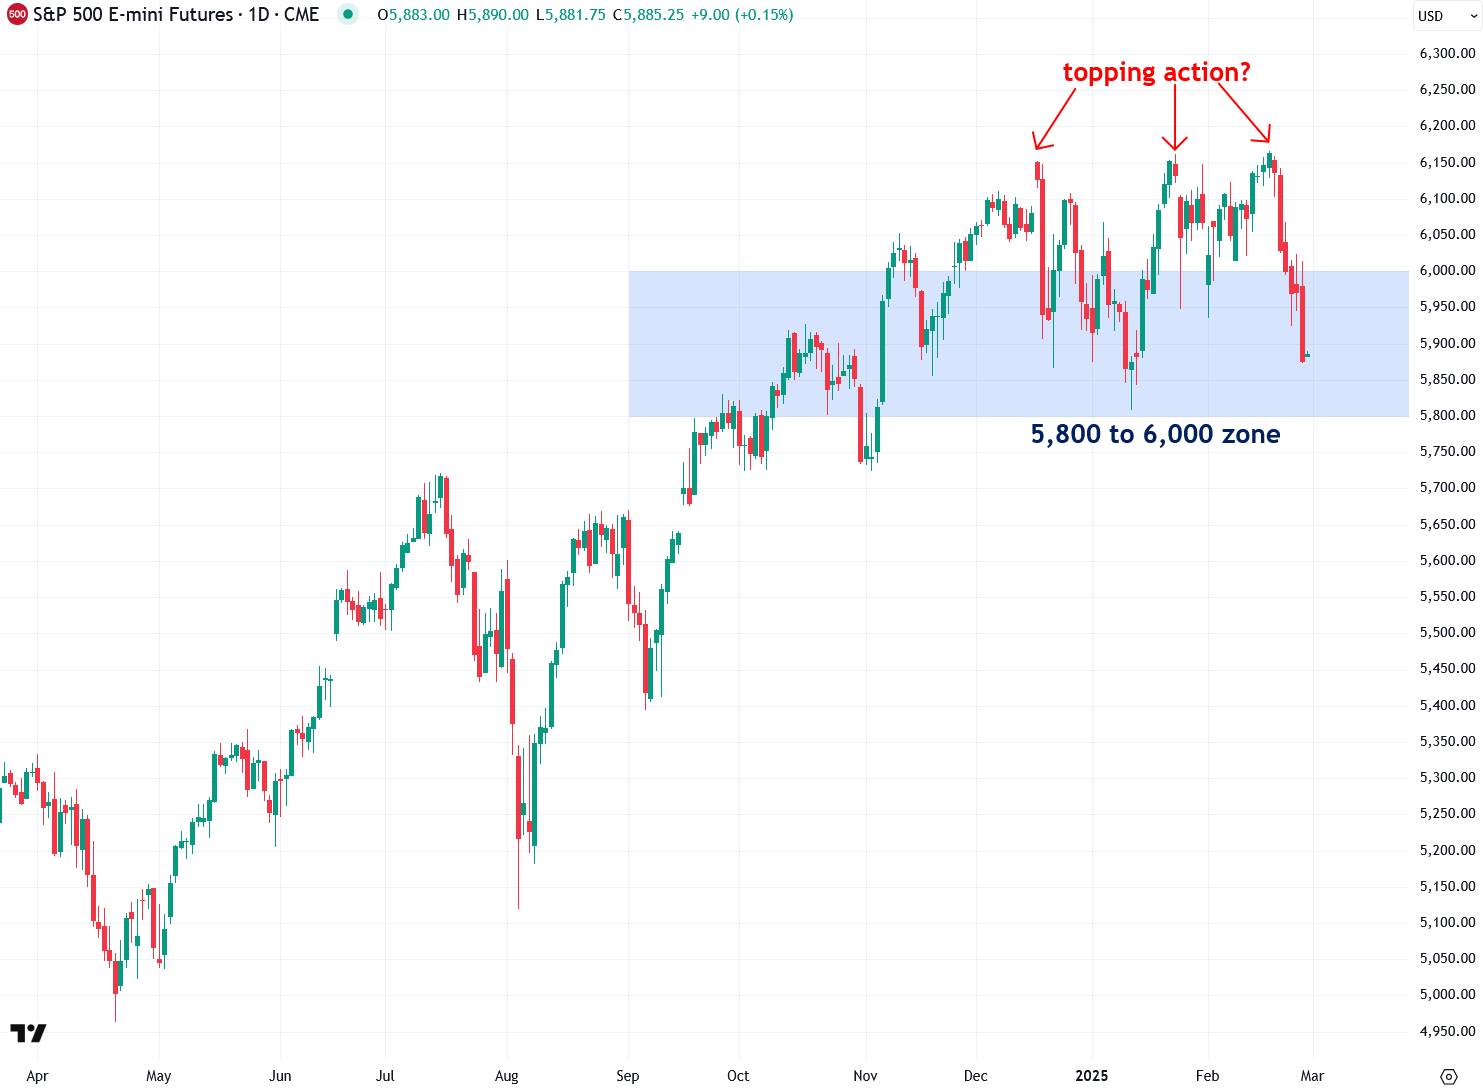
Now, let’s dive into the technicals, starting with the bellwether S&P 500. The index has plunged deeper into the 5,800–6,000 support zone I’ve been highlighting—a decisive break below this level would confirm an imminent breakdown and bear market. For now, I’m closely watching and waiting.
The tech-heavy Nasdaq 100 has officially broken below the critical 20,750–21,000 support zone I’ve been highlighting, signaling a serious technical breakdown. This is a major red flag, and I’m increasingly concerned.

The Nasdaq 100—and the broader market—has been heavily driven by the "Magnificent 7" stocks: Alphabet, Amazon, Apple, Meta, Microsoft, NVIDIA, and Tesla. A key gauge of their performance is the MAGS ETF, which tracks this group. As I noted on Tuesday, the ETF initially broke below the critical $53 support level, a bearish signal, and is now hovering just above it. If this support fails, I anticipate further declines in the Magnificent 7, which would trigger a broader market selloff.

Focusing on Nvidia—arguably the most influential stock in the world right now, given its leading role in the AI boom and nearly $3 trillion market cap—it plunged 8.5% today, wiping out $274 billion in market value and shaking the broader market. Ironically, this drop came despite a strong earnings report on Wednesday, where Nvidia posted $39.3 billion in revenue and earnings per share of $0.89, beating Wall Street’s estimates. However, even solid results weren’t enough to satisfy sky-high investor expectations—a classic risk when valuations reach extreme levels, as they have with Nvidia. Technically, the stock has now broken below an uptrend line that dates back to early 2024, signaling a bearish shift.