
A Simple Yet Powerful Technique for Identifying Trends
Learn how to tune out day-to-day noise and conflicting opinions, and see what this technique reveals about precious metals and mining stocks right now.

In addition to precious metals market updates and reports, I regularly share valuable tips and tricks that I find extremely helpful in my own market analyses and in the ones I share in this newsletter. I do this to ensure that all of my readers are on the same page and have the literacy needed to understand my analyses.
In today’s lesson, I am going to teach a simple yet powerful technique for identifying trends and looking past day-to-day noise and volatility in assets and markets, including but not limited to precious metals.
I was motivated to write this guide by the recent choppy behavior in precious metals caused by speculation about potential tariffs on U.S. gold imports. While this has created confusion, I have been consistent in telling everyone not to worry about the noise and to focus on the big-picture trend, which is highly bullish. So let’s dive in.
The tool I am teaching about today is the 200-day simple moving average (or 200-day MA for short). It is widely followed for identifying support and resistance levels, which is indeed useful. However, the unique way I use it is far less common and is even more valuable and powerful, in my opinion.
As a refresher for those unfamiliar, the 200-day simple moving average is calculated by averaging the last 200 days of closing prices of an asset. Each time a new data point is added, the oldest one is removed from the calculation, keeping the average focused on the most recent 200 days. This creates a rolling effect, allowing the moving average to track an asset’s price over time with a lag. It is useful for smoothing out noise and day-to-day volatility, making it easier to isolate the underlying trend.
The way I use the 200-day MA is by identifying its slope to determine whether the underlying trend is up, down, or sideways. In that sense, it is similar to the concept of a first derivative in calculus.

I consider myself a trend-following trader, and many of the greatest traders and investors of all time share that approach (learn more). Our mantras are “trade with the trend, not against it” and “the trend is your friend.” A trending asset is like a supertanker that needs two miles to turn around due to its strong momentum. There is a much greater chance of it continuing in the direction of the trend rather than reversing, so it is best to go with the grain instead of against it.
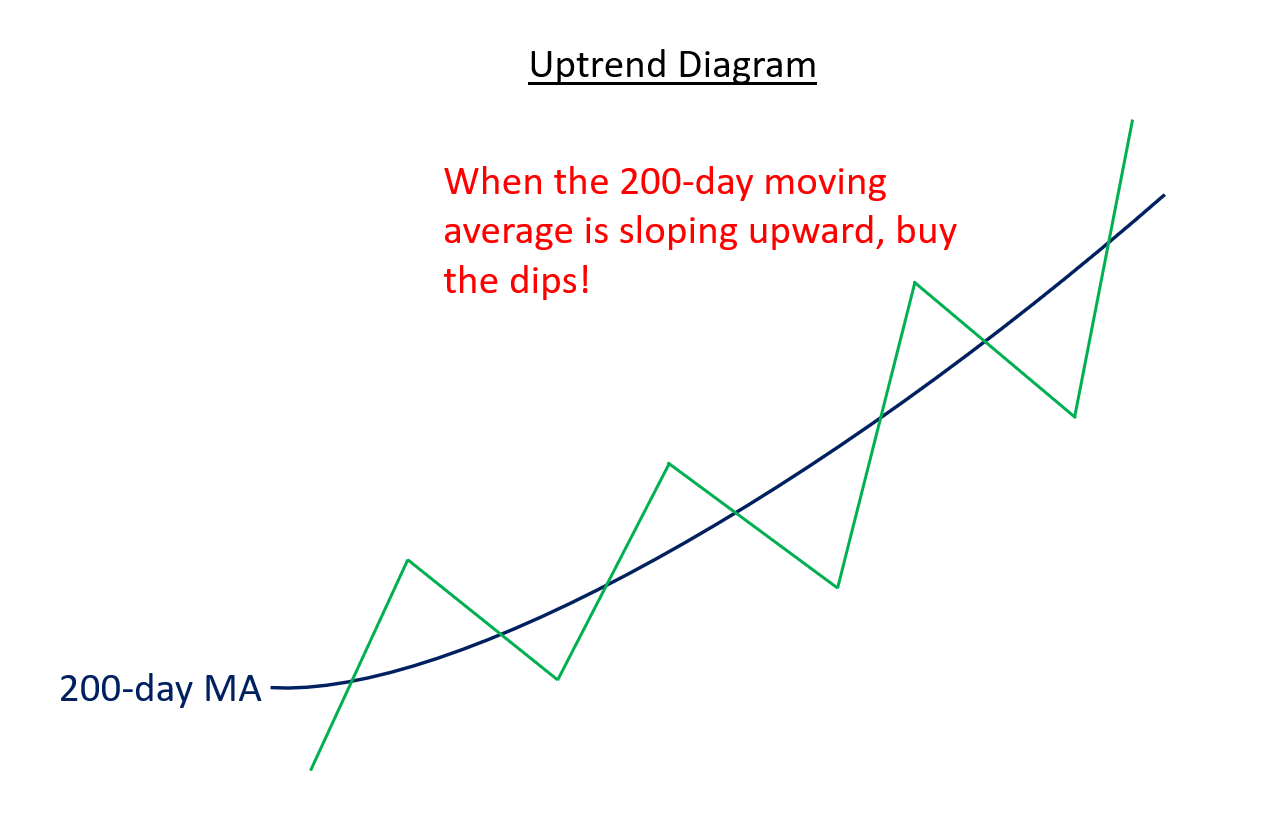
Next, let’s look at a series of diagrams that illustrate how I use the 200-day MA to determine an asset’s trend and establish my trading bias.
In the first diagram, we see an asset with a 200-day MA sloping upward, indicating a confirmed uptrend. In this scenario, I want to take only a bullish approach and avoid focusing on negativity, even when there are occasional down days. In a confirmed uptrend, this is when you want to “buy the dips,” as there is a high likelihood the asset will rebound and continue in the direction of the primary trend, which is up. Contrary to popular belief, buying the dips is not always a good strategy in all market conditions, as I will soon show—but it is effective when the trend is up.
The next diagram shows a sideways trend, indicated by a 200-day MA with little to no slope. This occurs when an upward- or downward-sloping 200-day MA flattens out, signaling a notable change in trend that is worth paying attention to.