
An Analysis of Gold in Different Currencies
A look at gold priced in 11 of the world’s major currencies to assess where it stands now and uncover insights that aren’t visible when analyzing it solely in U.S. dollars.

From time to time, I like to check in on gold priced in the world’s major currencies, and these analyses have become some of subscribers’ favorites. Though simple in theory, this approach is quite powerful and helpful because it often reveals insights that can’t be gleaned from looking at gold solely priced in U.S. dollars, which is the default approach and by far the most common.
One reason for this is that it helps reveal how gold is actually performing in its own right, rather than as a result of strength or weakness in the U.S. dollar, which often clouds the analysis. I’ve used this approach many times to spot major future moves in gold that were not visible when looking only at its price in dollars. For example, in the summer of 2024, it helped me foresee the surge from $2,500 to $3,000 at a time when many investors had grown confused and frustrated with it.
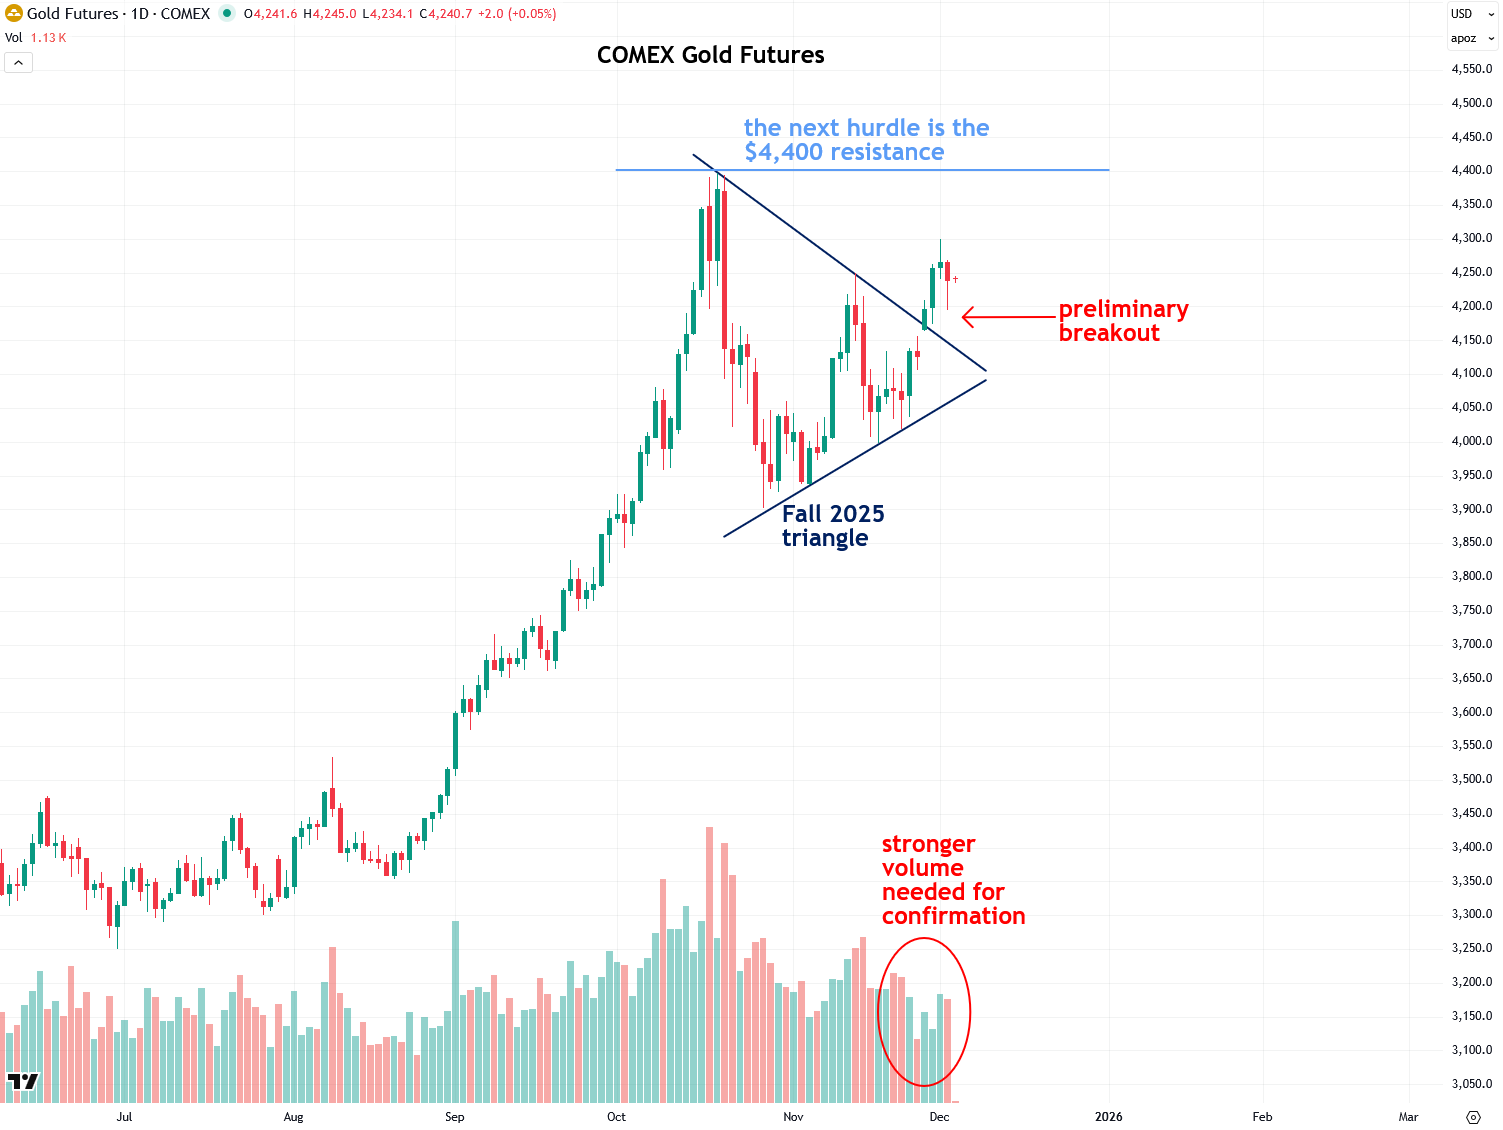
Analyzing gold priced in other currencies is especially useful during periods of consolidation, as it helps identify key levels and better anticipate when a true breakout and sustainable rally is likely to occur, rather than a false move or “bull trap” that quickly fades. Now is one of those times. As I explained in my last update, gold broke out of a triangle pattern a few days ago, but I have been holding out for additional forms of confirmation, including strong trading volume, to know when the real surge is about to begin.
Now let’s take a look at the charts, starting with COMEX gold futures, which are priced in U.S. dollars. As you can see, a triangle pattern has formed over the past couple of months, and late last week, it broke out of that pattern, which is a positive sign. I refer to this as a preliminary breakout because there wasn’t enough volume behind the move to confirm it fully, and because I am still watching for a decisive close above the $4,400 resistance level, which was established at the mid-October high. Breakouts above horizontal resistance levels are typically more reliable than those from diagonal resistance levels, such as the top of the triangle pattern.
That said, I believe gold is in a very strong position and there is no reason to worry, although it may continue to meander until it finally smashes through the $4,400 resistance level on strong volume. Once it does, I believe it should rally quickly to around $5,200, based on the measured move principle, as explained in this analysis.
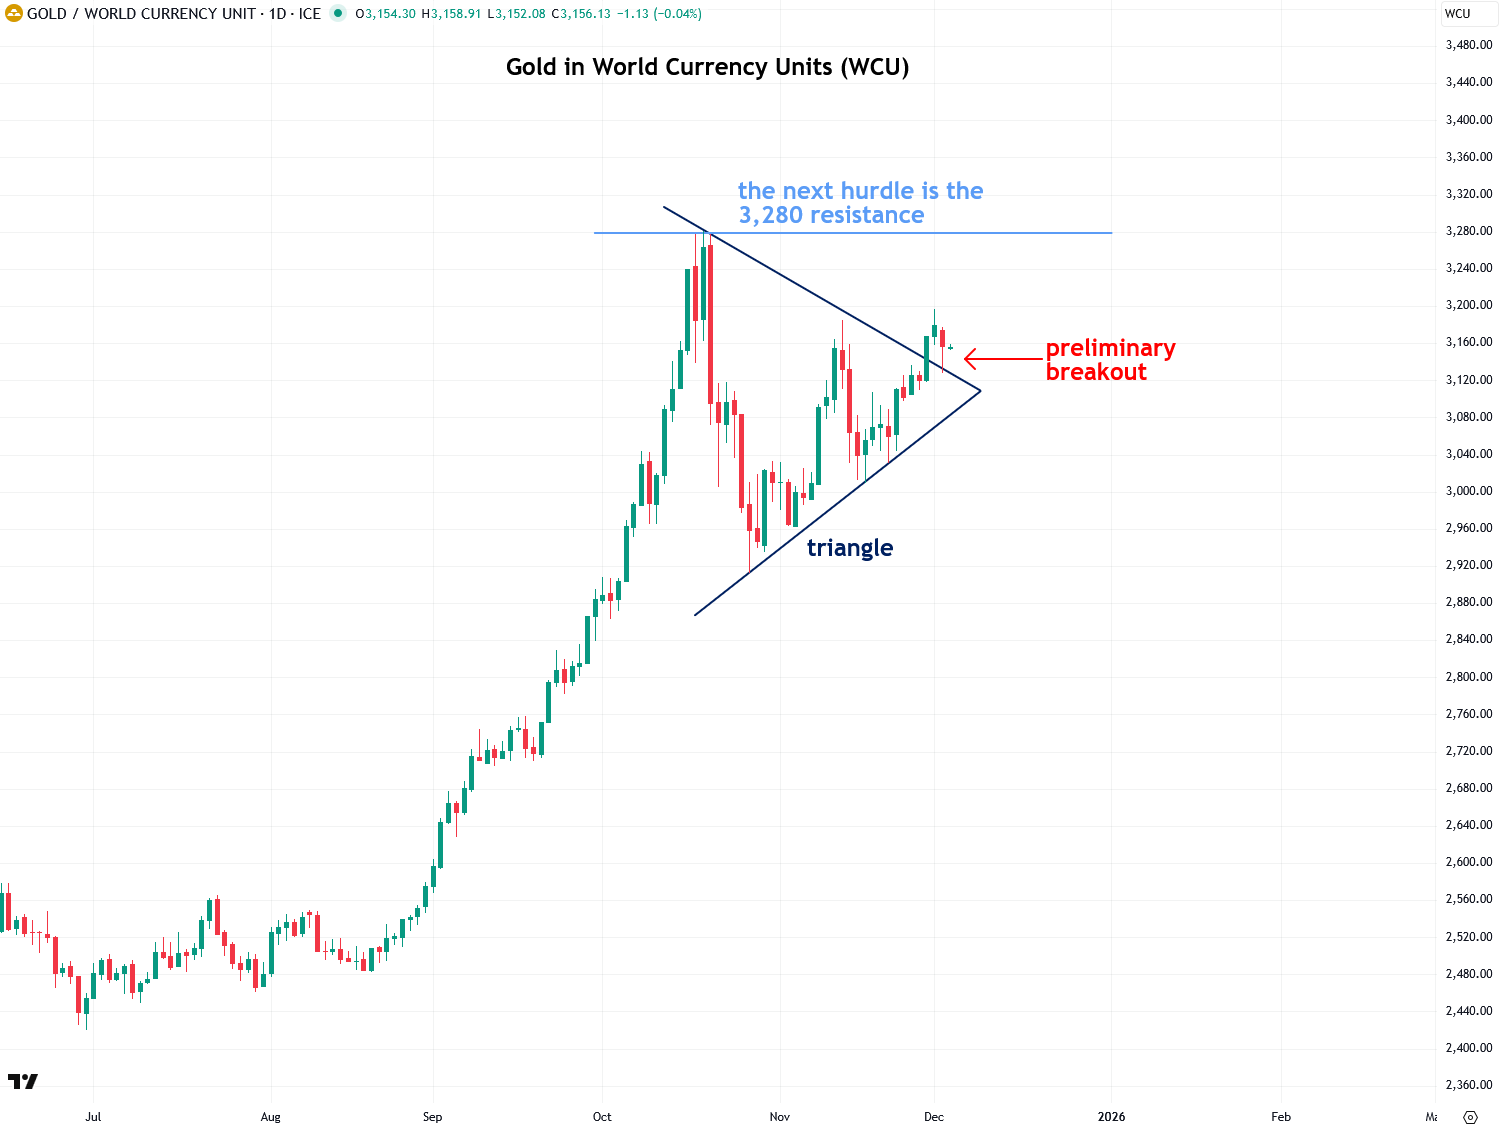
Next, let’s look at gold priced in the World Currency Unit (WCU), a composite currency based on the GDP-weighted average of the world’s 20 largest economies. In many ways, it offers the most balanced and accurate reflections of gold’s true global performance, which is why I pay close attention to it.
As with gold priced in dollars, gold priced in WCUs broke out of its triangle pattern a few days ago, and I’m now waiting for a solid close above the 3,280 resistance level, which formed at the October peak, for final confirmation.
I also pay close attention to gold priced in euros. It also broke out of a triangle pattern, and I’m now watching for a strong close above the 3,760 resistance level to confirm that the next rally is truly underway.