


Encouraging Signs Are Emerging in Gold & Silver
Precious metals successfully fended off a breakdown attempt today—a bullish sign that highlights underlying strength.

I just wanted to share a relatively brief update to highlight some encouraging signs I'm seeing in both gold and silver after today's trading session. The week started on a weak note for precious metals as upbeat news about global trade—particularly signs of a thaw with China—dampened safe-haven demand and fueled a rally in stocks and cryptocurrencies like Bitcoin.
However, something positive occurred today from a technical standpoint: gold and silver both attempted sharp breakdowns overnight, but those moves were strongly reversed during the U.S. trading session. As a result, both metals printed bullish reversal candles on the charts—which I’ll show next.
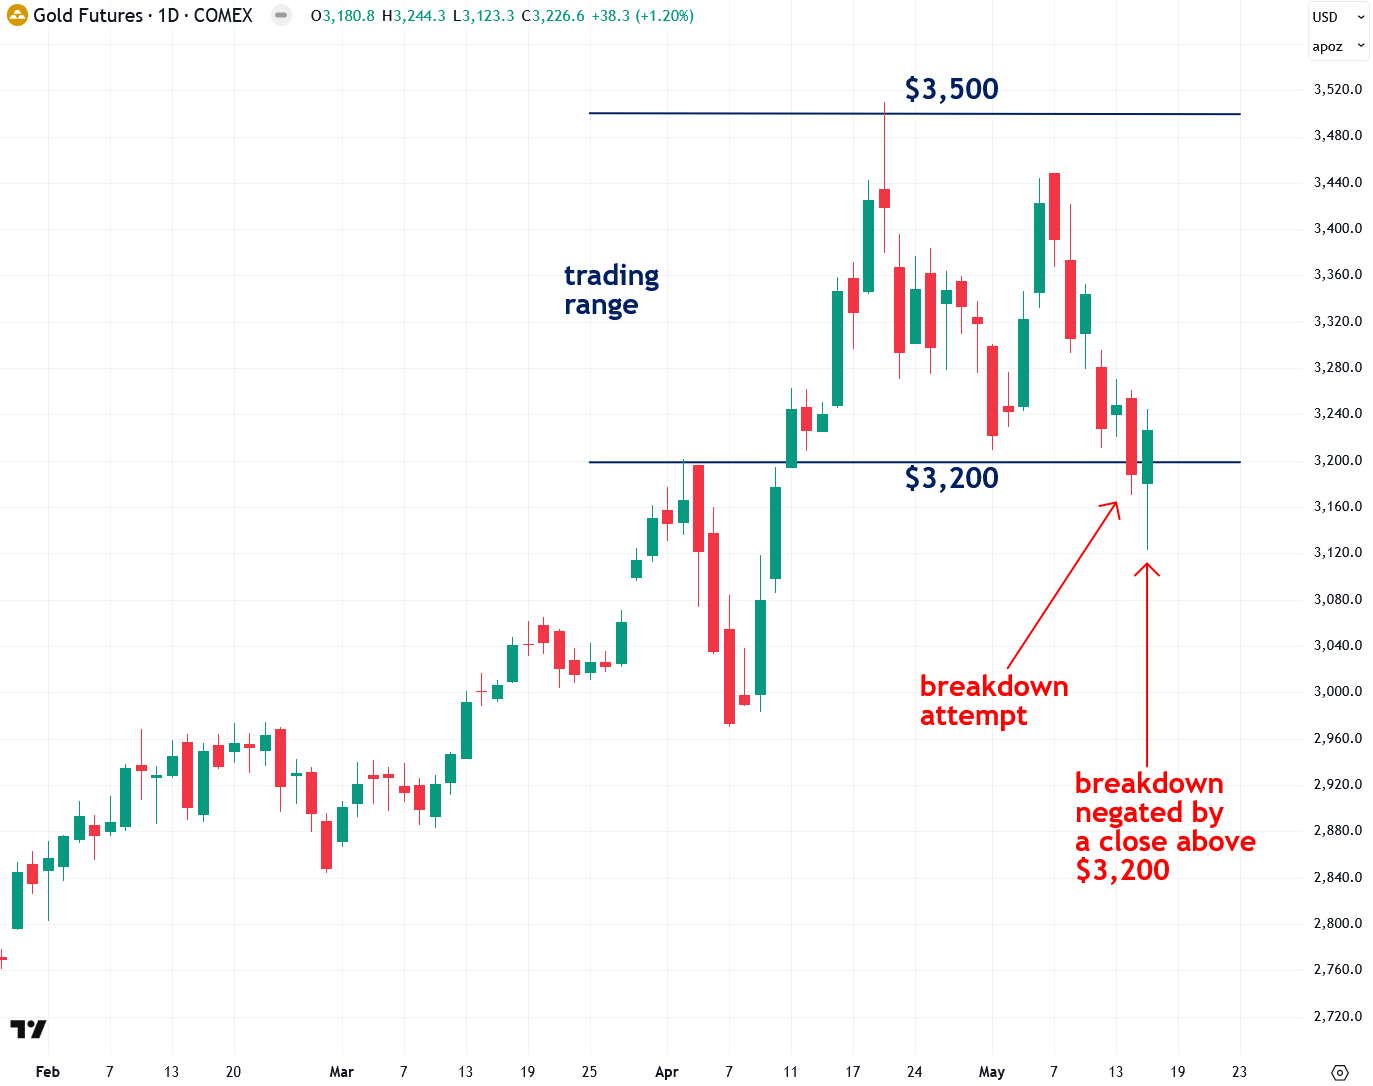
In my last gold and silver technical update on May 10th, I pointed out that COMEX gold futures had been consolidating between $3,200 and $3,500 over the past couple of weeks as the metal worked off its overbought condition following a sharp rally. However, last night and into this morning, gold futures experienced a sharp initial selloff that briefly threatened to break below the bottom of that trading range—a move that would have triggered a bearish signal and likely opened the door to even further downside.
Interestingly—and encouragingly—gold futures staged a strong recovery, climbing back above the key $3,200 level and closing above it. This rebound is a notable sign of technical strength and suggests that the worst of the downside may now be behind us. Today’s rally was driven by a combination of technical factors and weaker-than-expected U.S. economic data, including disappointing retail sales.
Today’s price action in gold—an initial sharp selloff followed by a strong rebound into the close—formed a candlestick pattern resembling a hammer. This pattern sends a clear message: the attempted breakdown was firmly rejected, which is a bullish signal.
Now that the bulls appear to be back in control, I’d like to see a continued bounce from here along with some healthy consolidation as gold works off its remaining froth. This would help gold reset and set the stage for the next leg higher—signaled by a strong close above the key $3,500 resistance level.
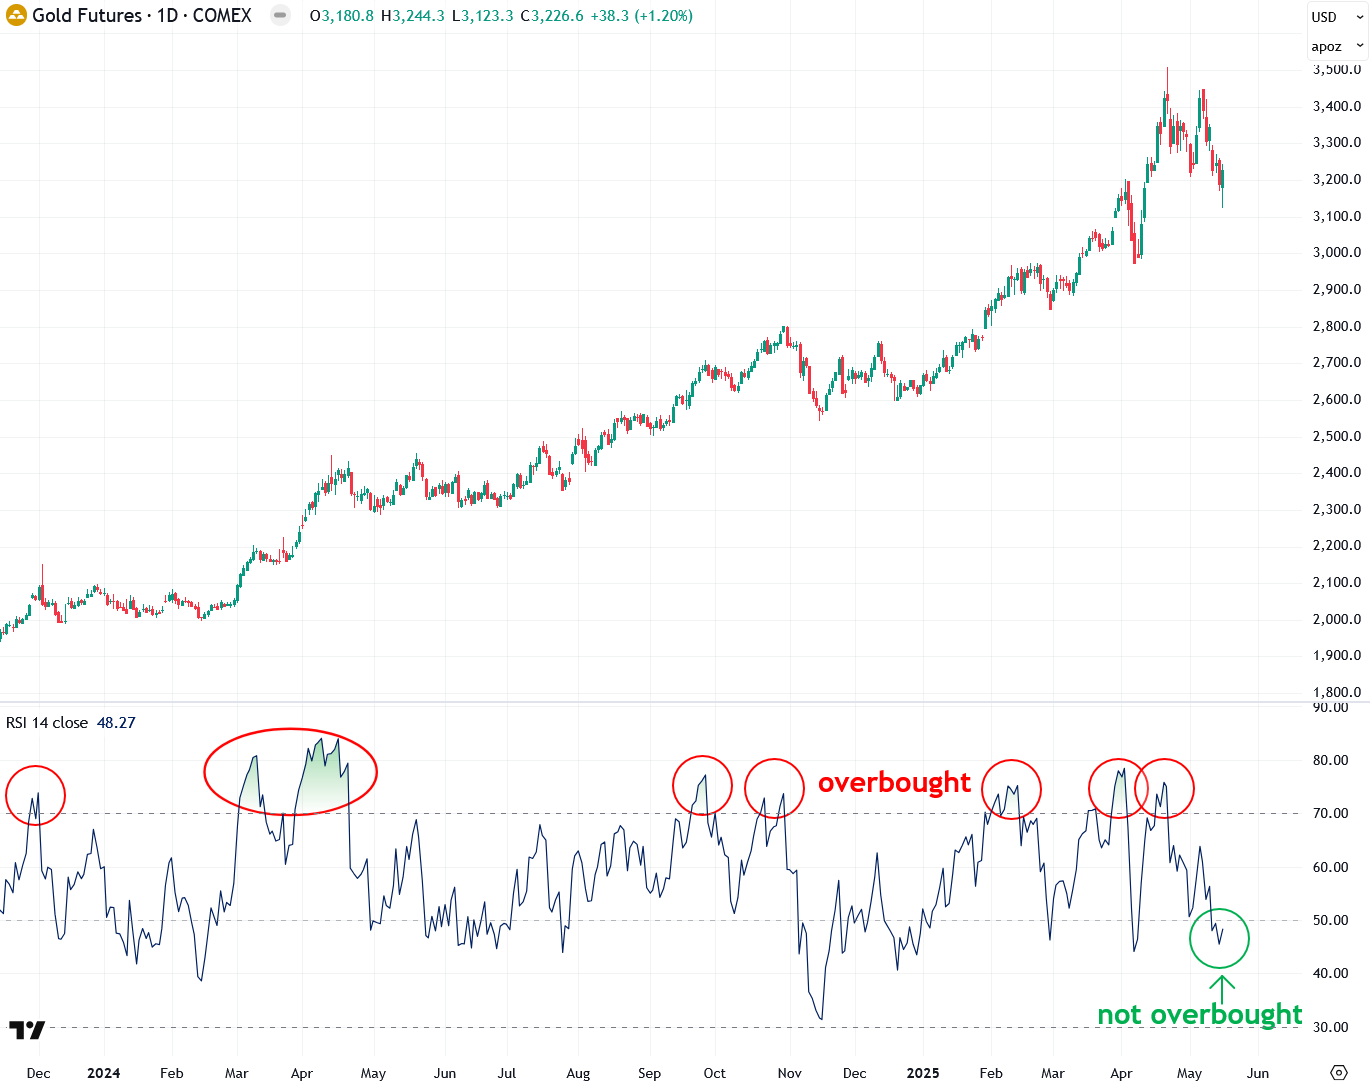
If you zoom out and view gold’s chart alongside the Relative Strength Index (RSI)—a useful momentum indicator that measures whether an asset is overbought, oversold, or neutral—you’ll notice a key change. Unlike in mid-April and at other previous peaks over the past year and a half, gold’s RSI is no longer overbought or stretched to the upside.
In fact, it’s now near the lower end of its typical range, indicating that the overbought condition has largely been worked off. This confirms that much of the froth has already been cleared, setting the stage for gold to resume its rally soon.
I also like to analyze gold in international currencies, as it strips out the influence of the U.S. dollar and highlights gold’s true intrinsic strength. Today’s strong rebound in gold priced in euros reinforces that the broader uptrend remains intact. The next key test is the critical €3,000 resistance level—a decisive breakout above it would be a powerful signal that gold’s next major rally leg is underway.
I’ve recently begun tracking gold priced in the World Currency Unit (WCU)—a composite currency based on the GDP-weighted average of the world’s 20 largest economies. In many ways, it offers one of the most balanced and accurate reflections of gold’s true global performance, which is why I’ve been paying close attention to it.
In my last update on May 10th, I noted that gold priced in WCU (World Currency Units) had been consolidating within a trading range between 2,400 and 2,600 in recent weeks. Early this morning, gold briefly dipped below the key 2,400 support level but quickly reversed with a strong bounce—an encouraging and clearly bullish sign. While further consolidation within this range is still possible, a decisive close above 2,600 would confirm that gold is ready to shift back into rally mode.

Next, let’s take a look at COMEX silver futures. Similar to gold, silver initially broke below both its uptrend line and the key $32 support level. Fortunately, it managed to recover and close strongly—a clear sign of underlying strength and a welcome development. As with gold, today’s price action in silver formed a candlestick pattern that resembles a hammer, signaling a failed breakdown and bullish reversal.
Now that the bulls appear to be back in control of silver, the next key step is a decisive surge and close above the $32–$33 resistance zone that it's currently trading within. Even more important will be a strong breakout above the $34–$35 resistance zone. Once silver clears those levels with conviction, I believe it will open the door to much more powerful upside ahead.
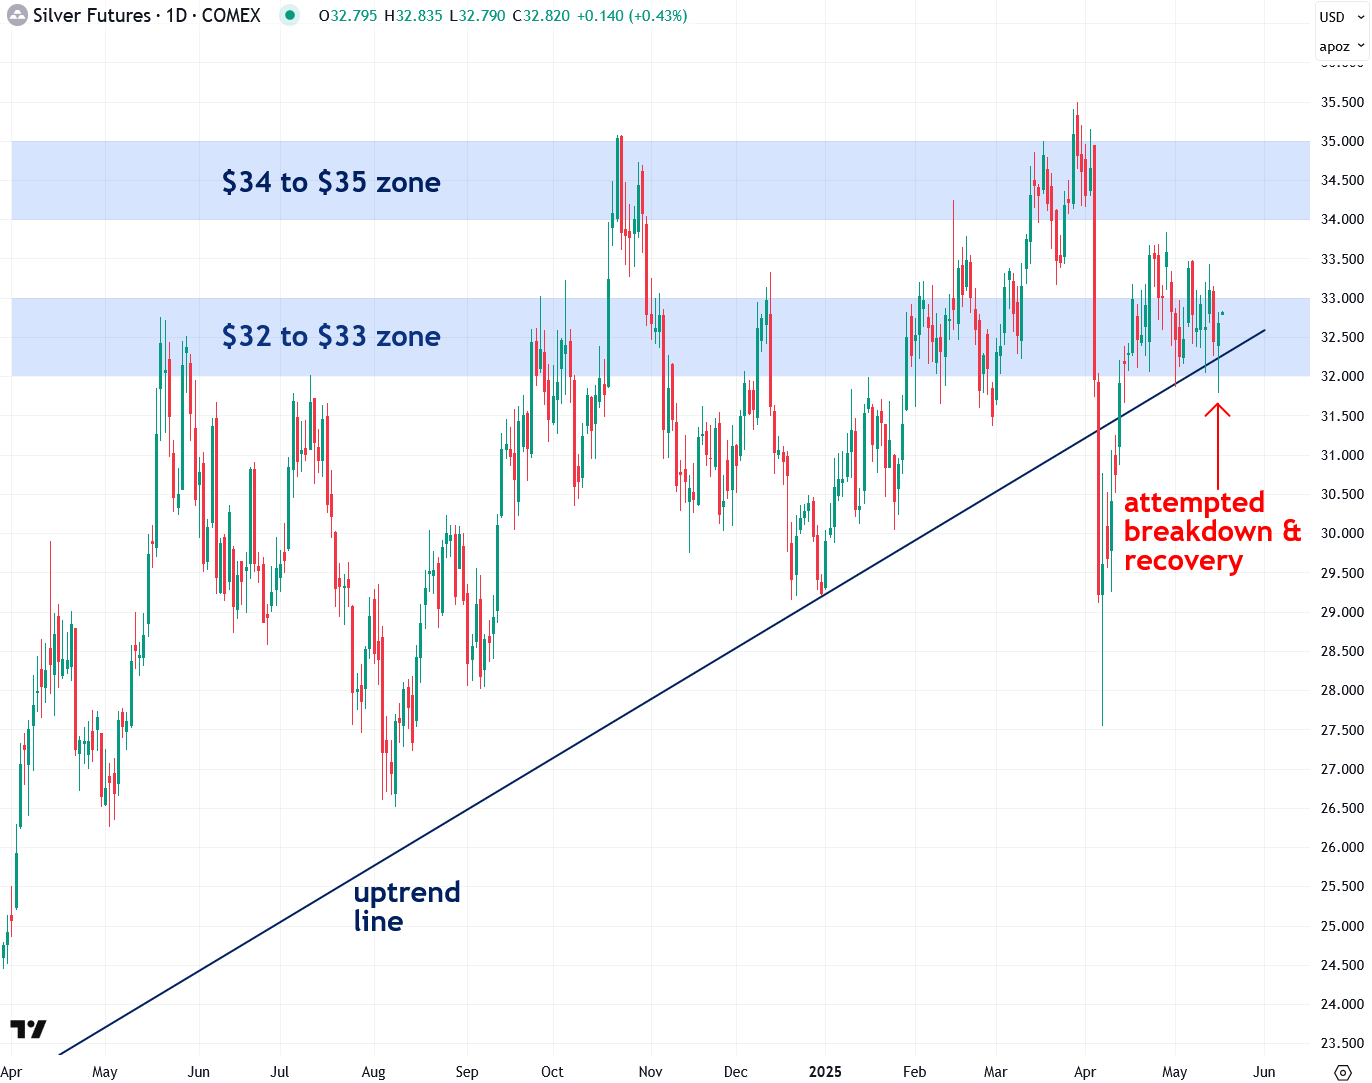
As I highlighted in my last update, silver remains in a short-term trading range between $32 and $34. It tested the $32 support level on May 1st and again today—and both times it bounced, which is a bullish sign of underlying strength. I believe a significant move is likely once silver breaks out of this range. While I’m hopeful it will be to the upside, I’m staying open to all possibilities.

Copper is also coiling tightly, building pressure within a consolidation pattern that resembles a triangle. A strong move is likely once it breaks out in either direction. I closely monitor copper because it plays a key role in influencing silver’s price action (you can learn more in my latest copper analysis).

Copper—along with gold—is one of the key components of my custom indicator, the Synthetic Silver Price Index (SSPI), which I developed to help confirm or challenge major price moves in silver. It’s calculated as the average of gold and copper prices, two metals that exert significant influence on silver. Interestingly, despite silver not being an input, the SSPI has shown a remarkably strong correlation with silver’s price—making it a valuable tool for cross-verifying trends and potential breakouts.
As I mentioned in my last update, the SSPI has been trading within a range between 2,850 and 3,000. Interestingly, this morning’s initial dips in both gold and copper briefly pushed the SSPI below the 2,850 support level—but it quickly rebounded. This recovery closely mirrors silver’s price action and further reinforces the bullish shift in tone we're seeing in silver itself.
One headwind for gold and silver in recent weeks has been the rebound in the U.S. dollar, as the dollar and precious metals typically move in opposite directions. During the market panic in early April, the U.S. Dollar Index briefly broke below the key 100 support level (see my analysis on why that’s significant), but it has since bounced back on a wave of renewed market optimism. That said, I remain skeptical about the sustainability of this dollar strength, as I’ve been outlining in recent updates.
To summarize, I was initially concerned last night and early this morning when gold and silver broke below key technical levels, as it would have signaled the likelihood of even further short-term weakness. However, I was pleasantly surprised to see both metals rebound strongly, erasing their losses and forming bullish candlestick patterns—such as hammers—that indicate a failed breakdown. As a result, momentum has shifted back to the upside, and I’m particularly watching silver closely as it approaches a breakout from its short-term consolidation pattern.
If you’ve enjoyed this report or have any questions, comments, or thoughts, please give this post a like and share your thoughts in the comments below—I’d love to start a dialogue and hear your perspective.
Disclaimer: the information provided in The Bubble Bubble Report and related content is for informational and educational purposes only and should not be construed as investment, financial, or trading advice. Nothing in this publication constitutes a recommendation, solicitation, or offer to buy or sell any securities, commodities, or financial instruments.
All investments carry risk, and past performance is not indicative of future results. Readers should conduct their own research and consult with a qualified financial advisor before making any investment decisions. The author and publisher disclaim any liability for financial losses or damages incurred as a result of reliance on the information provided.
Agree
jesse has documented a strong case that the stock markets in general are ready to crash
for a lot of reasons. further proof of this is that buffett has the largest cash position
in his entire 70 year career. he has $368 billion in cash!!!! the few stocks he has left
includes apple, amex, BoA, coke (his "forever" stock) occidental, chevron, and kraft.!you can see he does believe in hyrdocarbons (there are no "fossil fuels" for god's sake!) and not solar/wind
nonsense.
just hold your gold and silver and buy more if you can afford it. be patient! relax. be right
and hold tight. never trade. buy and hold just like buffett did all his life. all the sheeple are
going to go bankrupt, but we aren't.