
Encouraging Signs in Silver
Silver has broken out of the triangle pattern that formed over the past few months, but three major hurdles still lie ahead.

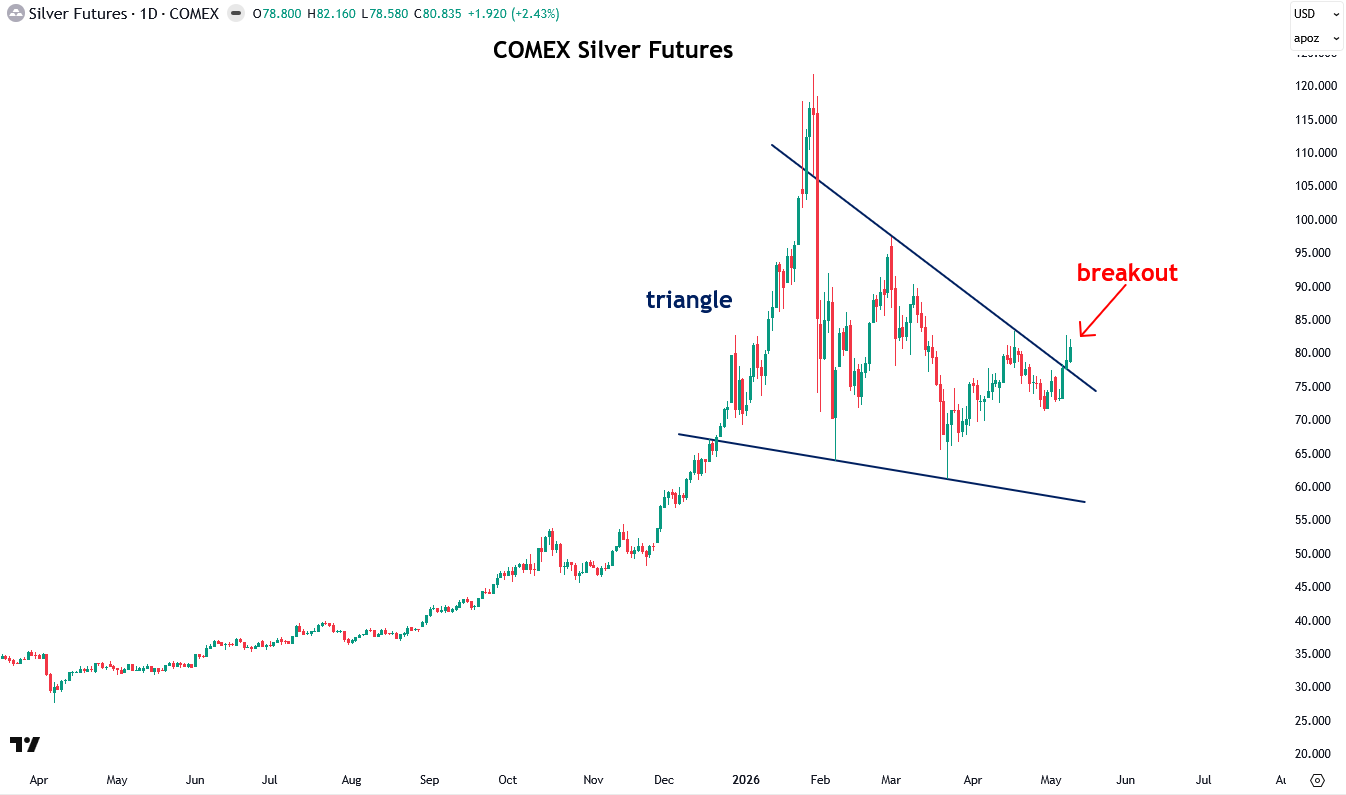
Early last week, I wrote a piece titled “Counting Down to Silver’s Next Major Breakout,” in which I showed how a triangle consolidation pattern had formed over the past few months and explained that a breakout from it should kick off the next phase of the bull market, taking silver to fresh all-time highs and into the high $100s thereafter. In the past couple of trading sessions, silver has broken out of that pattern, so in today’s update I want to show what I’m now watching for further confirmation.
Let’s start with the daily chart of silver to examine the triangle pattern and Friday’s breakout. As you can see, silver has clearly broken above the downtrend line connecting the late-February and mid-April peaks, signaling an important bullish change in trend.
Now that silver has broken above that downtrend line, I’m watching three additional major hurdles: the $80 to $85 resistance zone, $95 to $100, and finally $115 to $120. Breakouts above horizontal resistance levels and zones are more reliable than breakouts above diagonal resistance lines like the top of the triangle pattern, so I would like to see those zones surpassed for added assurance.
To learn more about support and resistance zones, I recommend reading my two-part tutorial on the topic (Part 1 and Part 2).
I would like to see silver close decisively above each resistance zone, and with each successive breakout, the odds of the next powerful leg higher will increase significantly. The final breakout above the $115 to $120 zone, which formed at the late-January peak, is the most important, as it would signal that silver has once again entered blue-sky territory and that the correction of the past few months is fully behind it.