
Is Another Oil Spike Ahead?
A look at a scenario in which oil surges to $150+ per barrel, which is not nearly as far-fetched as it sounds given that oil remains relatively cheap in real terms.

In a departure from my usual precious metals reports, today I’m publishing an analysis focused on oil and, more specifically, the potential for another spike in oil prices as global inventories rapidly deplete. I’ll also discuss what this could mean for precious metals and the global bond market, as well as ways investors can take advantage of this scenario.
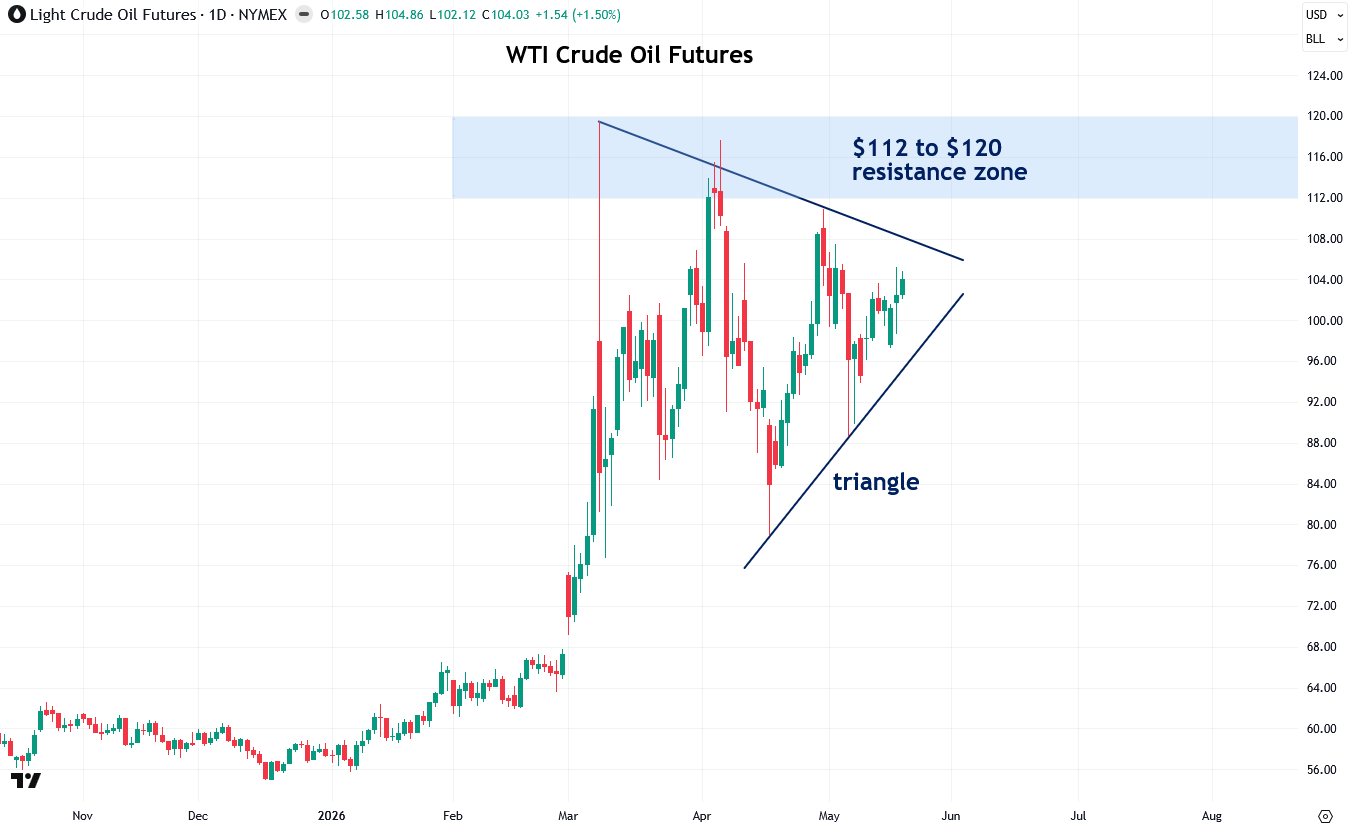
I want to begin with the daily chart of West Texas Intermediate (WTI) crude oil, the main oil benchmark in the United States. Since its initial Iran war-induced spike from roughly $68 to $120 per barrel in early March, crude oil has been surprisingly calm, trading mostly around the $100 level. However, there is a real risk that this is merely a pause or consolidation before another leg higher.
It turns out that the consolidation of the past few months has formed a triangle pattern, and these patterns are often continuation patterns that resolve in the direction of the primary trend, which in this case is up. Of course, confirmation is still needed in the form of a decisive breakout above the triangle accompanied by strong volume (learn more about confirming breakouts with volume).
Assuming a breakout from the triangle does occur, I would also like to see crude oil close decisively above the $112 to $120 resistance zone that formed at the three peaks in March and April for added confirmation. The reason is that breakouts above horizontal resistance zones and levels tend to be more reliable than breakouts above diagonal resistance levels such as the top of the triangle.
You can track WTI crude oil prices on Finviz.com.
To learn more about support and resistance zones, I recommend reading my two-part tutorial on the topic (Part 1 and Part 2).
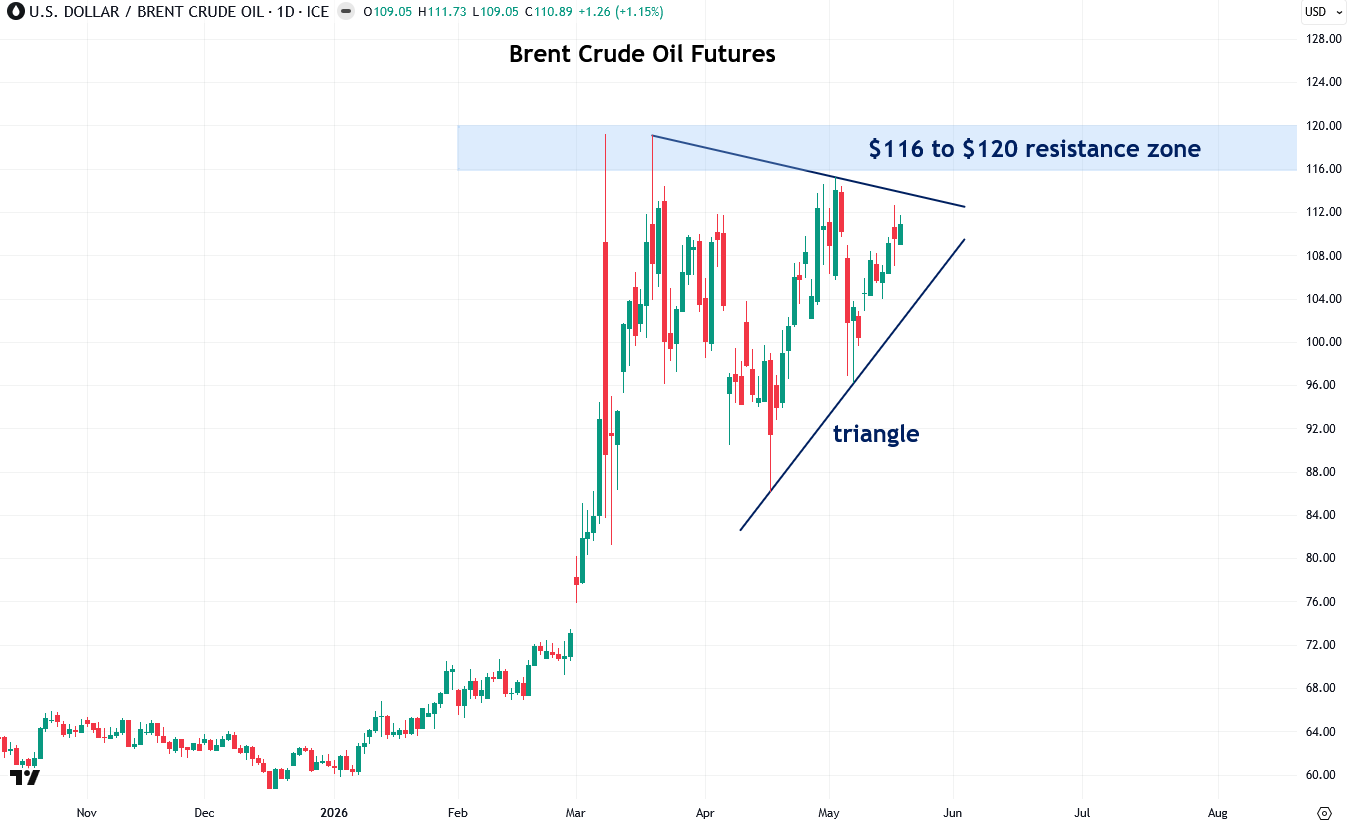
Next, let’s take a look at the chart of Brent crude oil, which is the main international oil benchmark. Like WTI crude oil, it has also formed a triangle pattern over the past few months, and a decisive breakout from it would likely signal another leg higher.
Ideally, the most reliable scenario would be for both Brent and WTI crude oil to break out of their respective triangle patterns simultaneously, which would increase the probability that the breakout is genuine.
In addition to a breakout from the triangle, a decisive close above the $116 to $120 resistance zone that formed at the recent peaks would provide even further confirmation that Brent crude oil is about to surge once again.
You can track Brent crude oil prices on Finviz.com.
Now that we’ve discussed the technical setup, let’s turn to the major fundamental reason there could be another spike in oil prices ahead: global commercial oil inventories are shrinking rapidly, eroding the critical buffer that has prevented oil from surging even higher than it did at the start of the Iran war in early March.
As International Energy Agency Executive Director Fatih Birol said on Monday regarding global oil inventories, “I think it is depleting very fast.” It will be “several weeks, but we should be aware of the fact that it is declining rapidly,” he said. He also said, “This could have major implications for the food prices and together with the higher energy prices they might give a big push to inflation numbers.”
Bloomberg recently published a harrowing chart from JPMorgan showing how sharply global oil inventories have dwindled since the start of the Iran war. Assuming no resolution to the conflict, the bank projects inventories falling to 7.6 billion barrels by June, a level considered the “operational stress level.”
If the war continues through September, inventories are projected to fall further to just 6.8 billion barrels, the so-called “operational floor level,” or the minimum required to keep pipelines functioning and refineries operating.
In other words, we are rapidly approaching the danger zone where a global energy crisis unfolds. It is plausible that this scenario is what the oil price triangle patterns I showed earlier are signaling.

Next, I want to show the long-term price chart of WTI crude oil to provide some perspective on where current oil prices stand relative to past cycles. At roughly $104 per barrel today, crude oil is near the upper end of its historical range going back to 1983, though it still remains well below the 2008 peak of $147 and the 2022 peak of $130.