
Precious Metals Continue to Rebound
The precious metals complex continues to rebound despite the renewed surge in energy prices, which is very encouraging behavior and further increases the odds of a strong second half of the year.

It’s time for a midweek precious metals and miners update. I’m pleased to report that precious metals have extended the powerful rebound that began in earnest one week ago, on August 5, with gold up 8%, silver up a little over 10%, platinum up 8%, and palladium up roughly 9%, while gold and silver miners have surged nearly 17% since then.
Even more impressive is that the precious metals complex has managed these gains in the face of yet another rebound in energy prices. Last week’s optimism over an imminent peace deal with Iran and the reopening of the Strait of Hormuz has once again turned to pessimism as peace talks have reached a stalemate, with Iran making a stiff list of demands that includes hundreds of billions of dollars in war reparations and restrictions on U.S.-aligned ships traveling through the strait. President Trump has countered with his own list of demands, including reparations from Iran for those who have died during the conflict.
As of now, the Trump administration has shifted its approach toward Iran away from heavy missile attacks and toward intensifying economic pressure, essentially trying to wait Iran out to see whether the country’s political regime will eventually crumble under the strain or be toppled by a domestic revolt or popular uprising. That was the original hope at the start of the war, but it never materialized as expected.
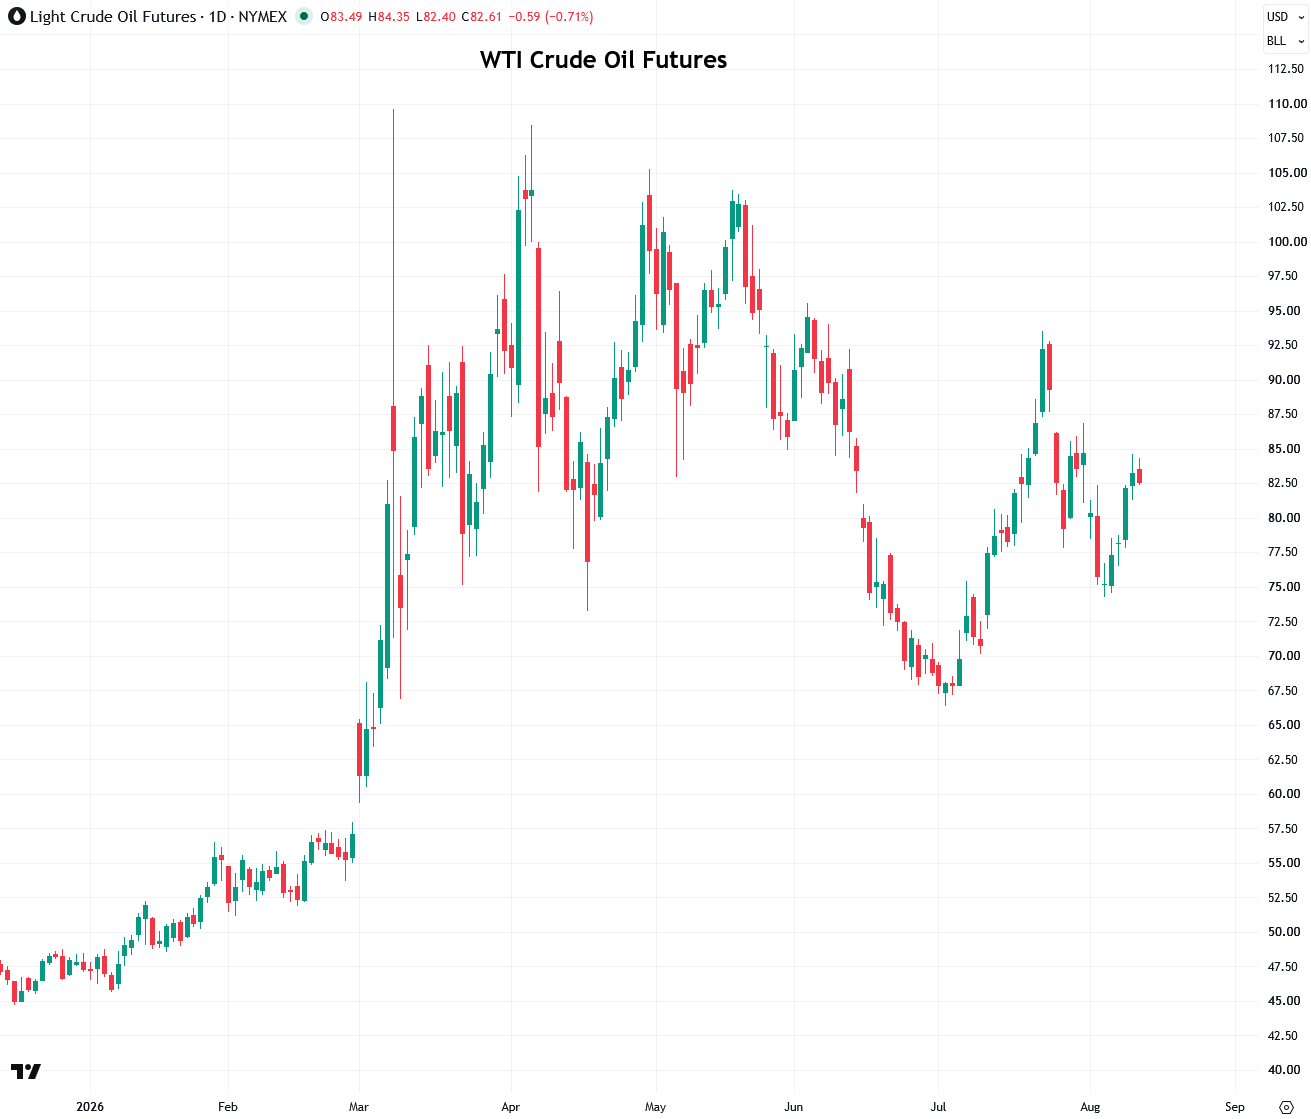
Due to growing skepticism over the prospects of an imminent peace deal, in a sharp reversal from last week’s optimism, energy prices have rebounded strongly. Over the past week, WTI crude oil has surged nearly 11%, Brent crude 13%, RBOB gasoline 11%, and heating oil/diesel 16%. Meanwhile, global oil inventories continue to sink to dangerously low levels, while the U.S. Strategic Petroleum Reserve has fallen to its lowest level since 1983.
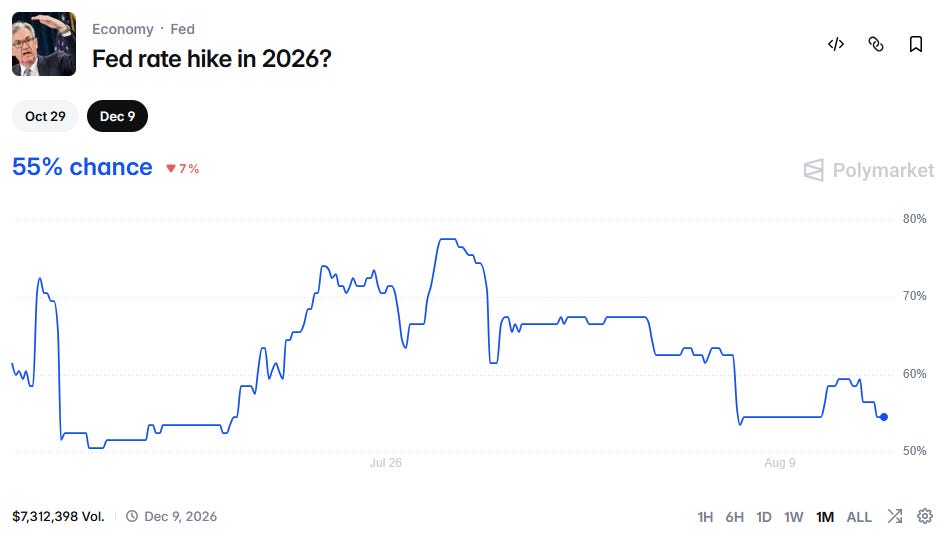
Remarkably, despite the sharp rebound in energy prices over the past week, the odds of a Fed rate hike in 2026 have fallen from their late-July peak of 78% to just 55% today. That decline has been aided by last week’s three weak U.S. jobs reports, as I explained in my weekend update, as well as Wednesday’s U.S. CPI report, which came in line with expectations and showed inflation easing for the second consecutive month, with headline CPI rising at a 3.4% annual rate in July.
The next major potential market-moving catalyst is another key inflation report: the U.S. July Producer Price Index (PPI), due Thursday morning. It is expected to come in at around 4.9% year over year, cooling from June’s 5.5% pace. Inflation reports are being watched more closely than usual by market participants as they attempt to gauge the odds of further Fed rate hikes, with the next Fed meeting scheduled for September 16.
My point in highlighting these interest rate expectations is that precious metals, as non-yielding assets, are highly sensitive to them. The rapid rise in rate expectations in recent months, driven by the Iran war and the resulting surge in energy prices, has been a major source of downward pressure on precious metals.
Now let’s take a look at where precious metals stand, starting with gold, which leads the overall complex.
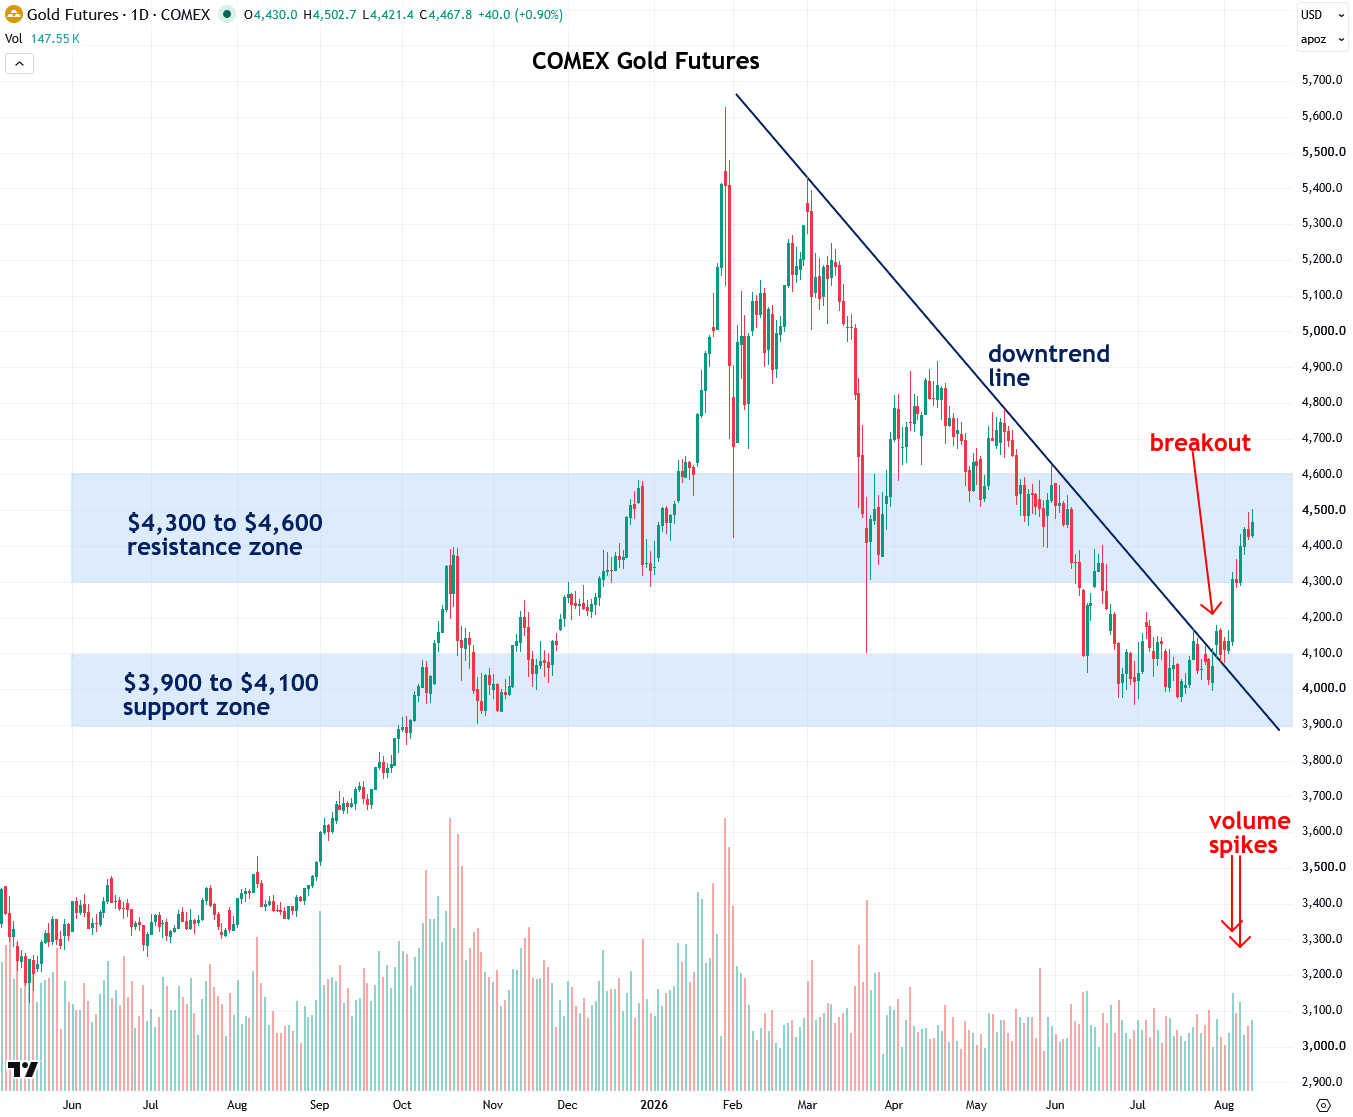
After testing the key $3,900 to $4,100 support zone from late June through early August, gold was unable to break below it and instead staged a powerful rebound. It has now erased much of its sharp June selloff, which is a very relieving and encouraging development that greatly increases the chances that the correction that began in January is finally over and that the long-term bull market can resume its upward trajectory.
Gold is now deep into its $4,300 to $4,600 resistance zone, which formed over a nine-month period from the key highs and lows between October and June. That is a very encouraging sign, though I would like to see gold break fully above this zone for even greater confirmation of this bullish change in trend. Assuming that occurs, the odds of the next leg higher and a strong rally into year-end, not just for gold but for the entire precious metals complex, will increase significantly.
With gold having surged roughly $500 per ounce in just a couple of weeks, it is now a bit extended in the short term, increasing the chances of a brief pullback or consolidation phase. For those looking to enter trades in either gold or gold mining stocks (as opposed to stacking bullion), I would therefore exercise some caution for now and wait for a brief cool-off period, then look to buy upon a breakout from that consolidation, especially since there is still significant resistance overhead that needs to be cleared.
Rebounds from major corrections like the one we have experienced since January are a process and rarely occur in a straight line. Instead, they typically unfold through a series of rallies followed by consolidations, then further rallies as each successive resistance zone or level is surpassed like another hurdle.
The final and most important hurdle is the peak reached just before the correction began. Once that level is decisively surpassed, the asset enters blue-sky territory with no obvious resistance overhead, allowing it to rally much more freely than during the process of digging its way out of a correction.
It’s also important to remember that we are still deep in the dog days of summer, with trading volume across the financial markets remaining very light and trading conditions unusually thin, which tends to amplify reactions to economic data and headlines. Once summer ends and volume begins to normalize in September, I believe the odds of a successful and sustained rally will greatly increase, as volume is the lifeblood of the financial markets.
To learn more about support and resistance zones, I recommend reading my two-part tutorial (Part 1 and Part 2).
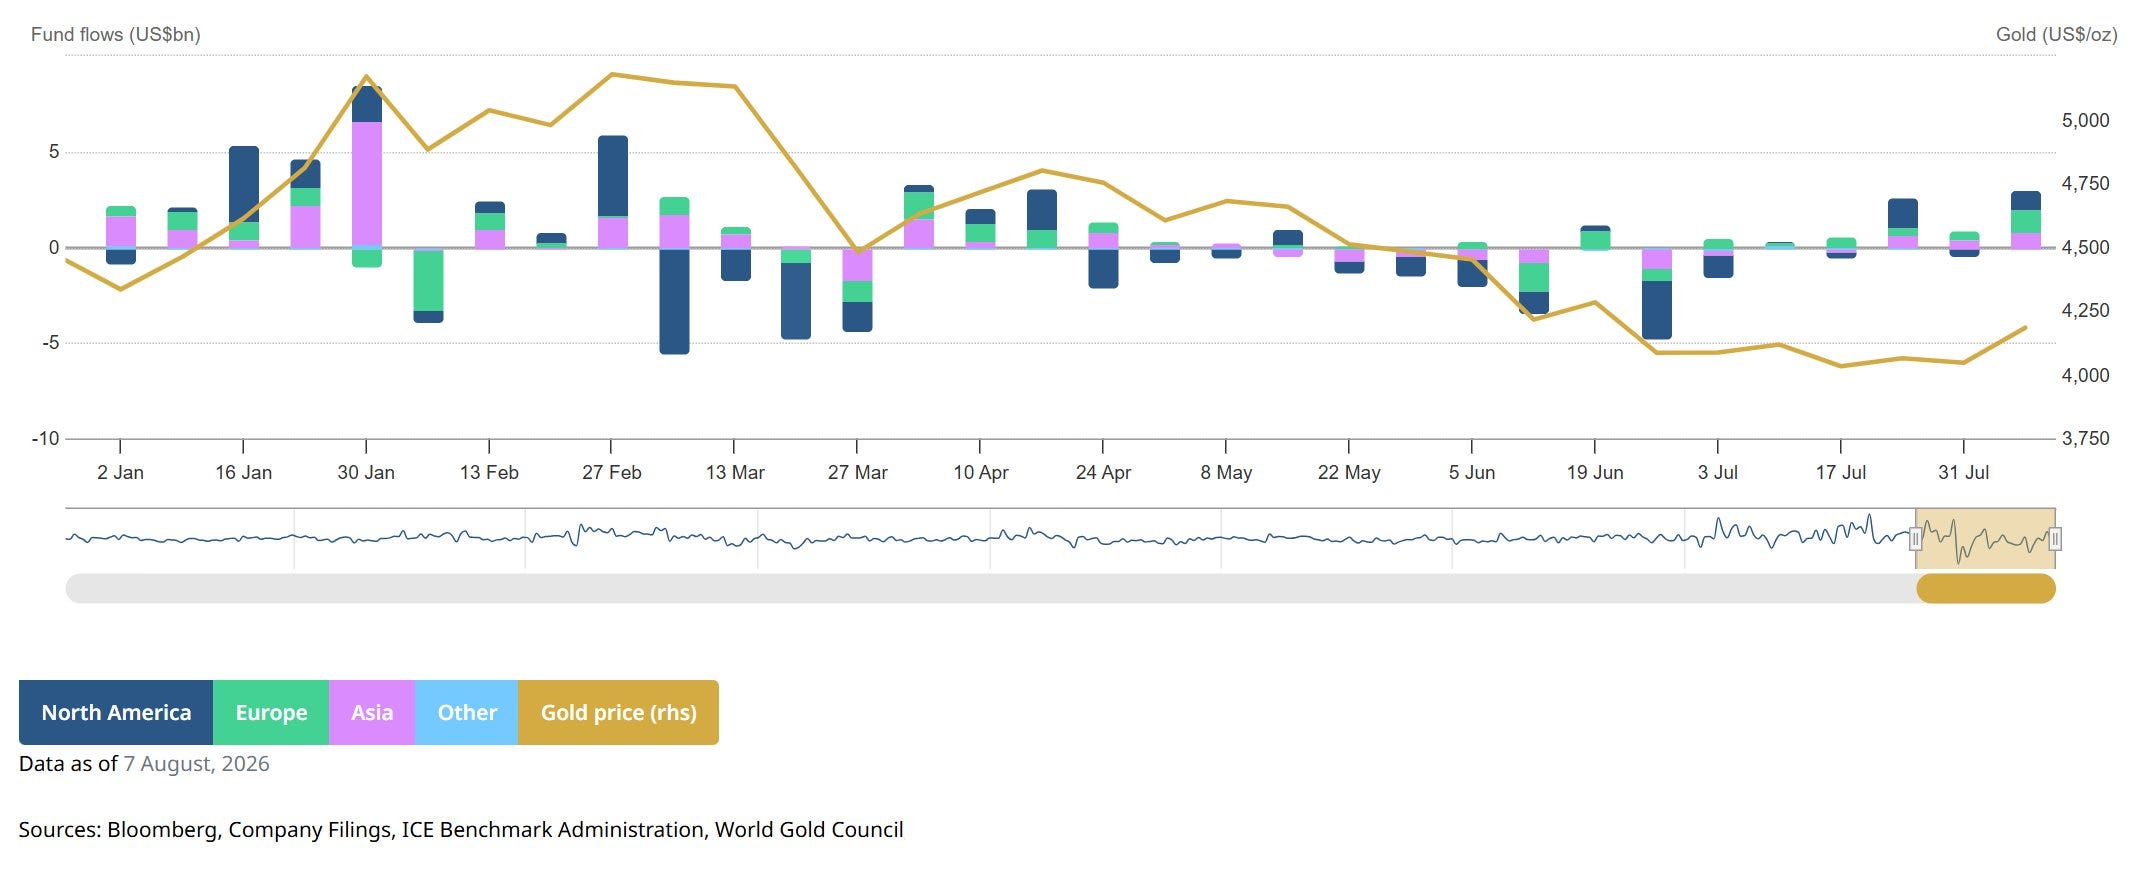
Further good news for the nascent gold rebound can be seen in global exchange-traded fund (ETF) flows, with gold ETFs attracting $3 billion in net inflows last week, marking the fifth consecutive week of positive net inflows:
Moving on to silver, we can see that it has rebounded strongly off its key $45 to $55 support zone, closed above the downtrend line that had been in effect since late January, and is now pushing deep into the important $60 to $70 resistance zone formed by the key lows between December and June.
I am impressed with silver’s recent price action and am now waiting for it to fully surpass its $60 to $70 resistance zone for even greater assurance that the correction is behind us, though that is already my suspicion. Each successive push above resistance following a correction increases the odds of a successful return to the long-term trend, which in silver’s case remains firmly upward.