
Stop Worrying About a Correction in Precious Metals
Amateur investors and wannabee analysts are panicking over gold and silver being overbought, without realizing that persistent overbought conditions are a hallmark of every strong bull market.

In the days since gold broke out of its summer doldrums—just as I predicted—it has sparked a frenzy of reactions from investors, traders, and analysts at every level, from retail to professional. Many are suddenly panicking and calling for a correction in both gold and silver. I've also been inundated with worried messages and comments asking if precious metals are about to plunge. The typical claims are circulating again: gold has risen too far and too fast, it's overbought, it's too expensive, and it must be due for a correction. Some are even calling the bull market a bubble.
What’s striking is that most of these critics failed to foresee the gold bull market over the past two years, yet they are now quick to dismiss it. Whether they are motivated by envy, fear of missing out, or simple ignorance, their arguments are deeply flawed. In this update, I want to respond directly to these concerns, dismantle the bearish claims, and reassure you that gold and silver are not only holding up well, but are also in one of the most powerful bullish setups in years. The skeptics will be proven wrong in dramatic fashion.
The primary reason many investors and analysts are calling for a correction in gold is its overbought condition following last week's breakout. An asset is considered overbought when it becomes technically stretched to the upside after a sharp rally. This status is typically measured using momentum-based technical indicators known as oscillators, such as the Relative Strength Index (RSI) or Williams %R. In the gold chart below, the Williams %R indicator is shown beneath the price action and currently reflects gold’s overbought condition.
(In this report, I’m using charts from StockCharts.com instead of my usual TradingView charts because, for teaching purposes, I prefer how StockCharts visually highlights the Williams %R indicator. The green and red shading makes it easier to see when an asset is overbought or oversold.)
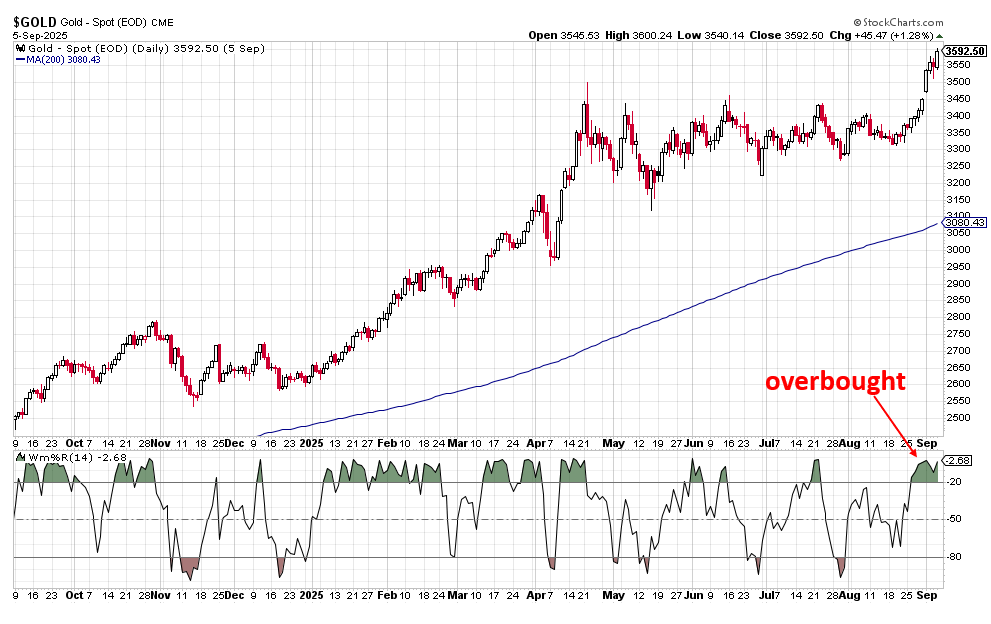
While I acknowledge that gold is indeed overbought according to the most widely followed oscillators, I want to emphasize that this is not a negative development, contrary to what the gold bears are claiming. In fact, it's quite the opposite. Overbought conditions can be a sign of strength and improving sentiment—both of which are bullish traits. I’ll expand on that point shortly.
The current gold bears and many amateur traders often misinterpret overbought or oversold conditions by assuming they are always negative or positive signals. In reality, my extensive research and experience show that these conditions are highly context-dependent. Their meaning varies depending on whether the asset is in an uptrend, a sideways trend, or a downtrend. Calling attention to these conditions without understanding the broader trend is a classic example of how a little bit of knowledge can be a dangerous thing—and that is exactly the mistake the gold bears are making right now.
Before going any further, I highly recommend reading my recent tutorial where I explained a powerful yet simple technique for identifying trends in financial markets and assets. It provides valuable background that will help you better understand the arguments I present in the rest of today’s report.
To give you a quick overview, one of the most powerful and reliable techniques in trading and investing is learning how to identify the trend of an asset and trade in the direction of that trend, not against it. As the old sayings go, “the trend is your friend” and “trade with the trend, not against it.” By aligning with the prevailing trend, you dramatically improve your odds of success, since assets are more likely to continue in their current direction than to reverse unexpectedly.
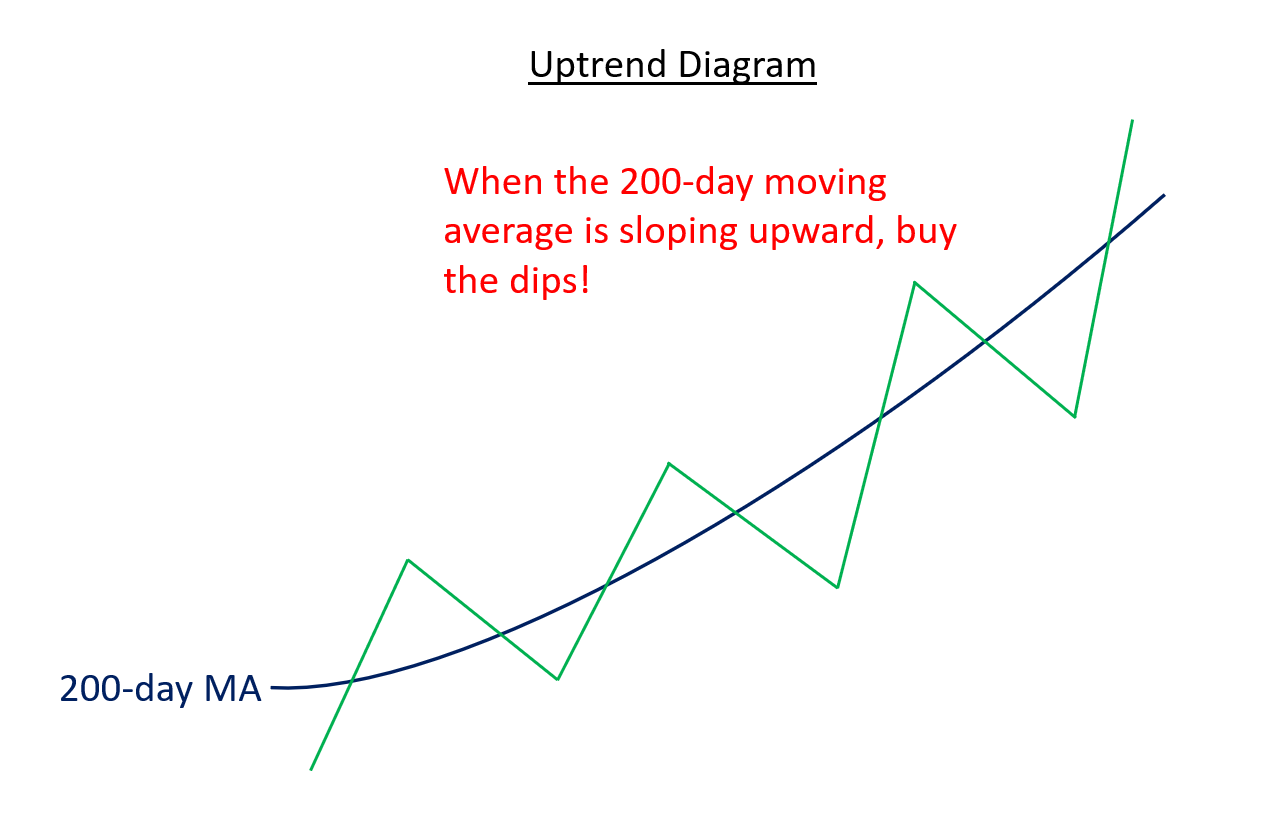
There are several ways to identify the trend of an asset, but in my experience, the most efficient and effective method is to examine the slope of its 200-day moving average (MA). If the moving average is sloping upward, the asset is in a confirmed uptrend. If it is flat, the asset is in a sideways trend. If it is sloping downward, the asset is in a confirmed downtrend.
Once the trend of an asset is established, it helps define your trading or investing bias. For example, if an asset is in an uptrend, I focus solely on the bullish case and look for opportunities to maximize gains from long positions. I intentionally ignore negative commentary, such as the current claims from gold skeptics, because it distracts from the broader upward trend. Conversely, when an asset is in a downtrend, I concentrate on the bearish outlook and avoid giving weight to positive news, since it often fails to change the overall direction and is usually followed by further weakness.
With that foundation in place, I’ll now explain how to interpret overbought, neutral, and oversold oscillator readings depending on the type of trend. Each scenario is very different and requires a distinct approach.
In a confirmed uptrend, the best approach is to "buy the dips" when oscillators show oversold conditions. Overbought readings should be ignored, as they are completely normal during strong uptrends and should actually be welcomed as signs of strength and momentum. That’s why I’m not at all concerned about the current overbought readings in gold and silver, unlike the Chicken Littles who are panicking and calling for a correction.