
Why Precious Metals Are So Volatile Right Now
The recent surge in gold and silver volatility was predictable months ago for those who understood the principles of volatility cyclicality and volatility squeezes. So here is what comes next.

Despite their well-earned reputations as stable assets and safe havens, gold and silver have become highly volatile in recent weeks, with sharp moves in both directions. This marks a significant change in behavior and has sparked widespread discussion across the financial world, particularly after last week’s steep declines. Gold dropped from $4,400 to $4,000, a loss of about 9%, while silver fell from $54 to $48, or roughly 11%, all within just a couple of days.
This volatility was entirely foreseeable, however. I explicitly called for it back in August, at a time when the precious metals space was eerily calm and before gold’s $1,000-per-ounce surge in the fall. Today’s piece follows up on that earlier analysis, contextualizes the recent swings in precious metals, and explains why the current wave of volatility should settle down soon.
To better understand today’s update, I recommend first reading my gold-focused report from August, which I just referenced, along with the follow-up piece on silver. Both reports explain the important concept of the cyclicality of volatility, as well as related ideas such as volatility squeezes and volatility breakouts. They also outline the key technical indicators I use to monitor volatility, namely Bollinger Bands and Bollinger Band Width.
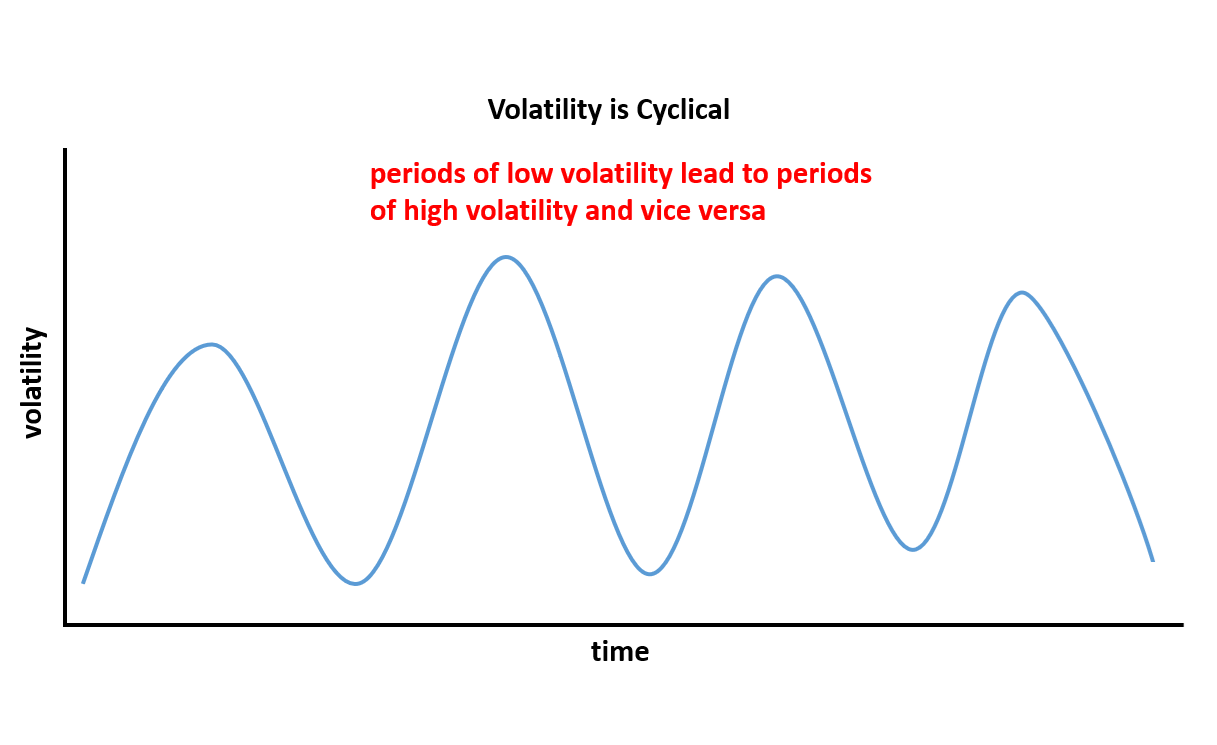
As a refresher, volatility in financial assets and markets is highly cyclical. While asset prices like precious metals and stocks may not follow clear cycles, the volatility of those prices does, consistently moving through repeating phases of low and high volatility. Periods of quiet, low volatility tend to build pressure that leads to sharp spikes in volatility, which then eventually subside, starting the cycle again. See the diagram below for a visual of this repeating pattern.
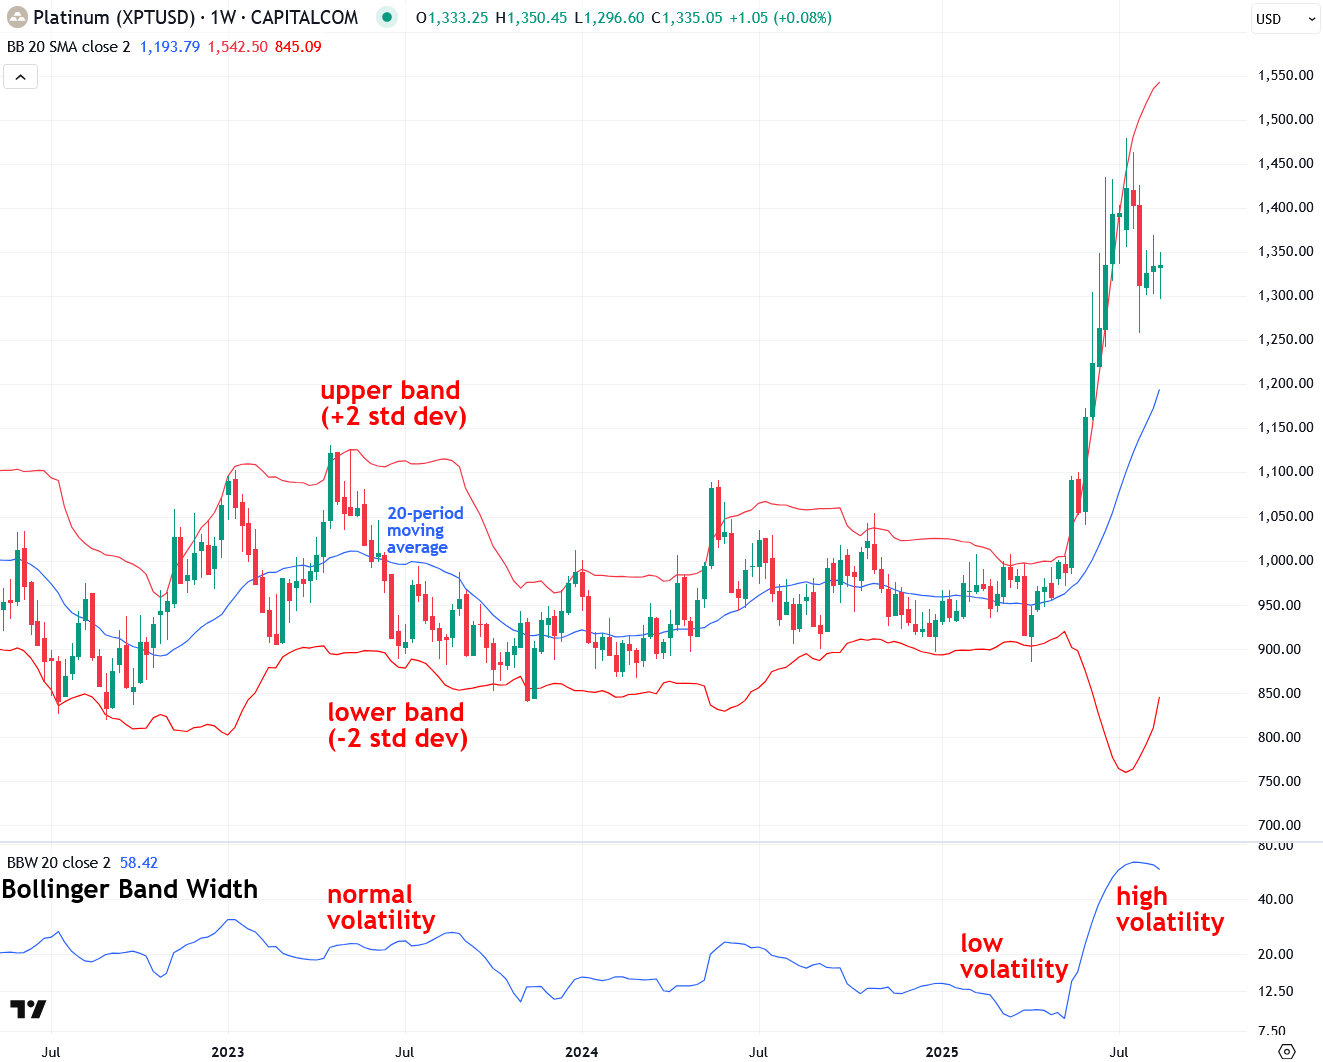
Next, let’s discuss how volatility can be measured and monitored in the real world. While there are a number of ways to do this, one of the most efficient and widely followed is to use an indicator called Bollinger Bands, which, when applied to a chart of an asset such as platinum in the example below, envelops the price.
The way the Bollinger Bands indicator works is that it takes a 20-period moving average of the asset’s price (the blue line in the chart below), and then upper and lower bands (the red lines in the chart below) are plotted two standard deviations above and below the moving average.
There are several ways to use Bollinger Bands, such as treating the upper band as a resistance level and the lower band as a support level. However, that’s not the focus today. Instead, I’m going to focus on the width of the Bollinger Bands as a way to measure the volatility of the asset they’re applied to. Simply put, when the bands are close together, the asset has low volatility; when the bands are wide apart, the asset is experiencing high volatility—based on the past twenty trading periods, whether measured in days, weeks, or another timeframe.
While it’s easy to eyeball the Bollinger Bands to gauge their width and the asset’s volatility, there is another helpful related indicator called Bollinger Band Width that makes this even easier. You can see it plotted on platinum’s weekly chart below. The chart shows clear periods of normal volatility, low volatility, and high volatility. When an asset moves sideways for a while, volatility is low, and when it trends strongly either up, as platinum has in recent months, or down, volatility is high.
Now that we’ve briefly covered the theory behind how volatility works in financial markets and how to monitor it, I want to discuss the powerful concept of a volatility squeeze. As mentioned at the start of this report, volatility is highly cyclical: periods of low volatility are followed by periods of high volatility, and vice versa.