
A Comprehensive Bullish Case For Gold Mining Stocks
Discover why gold mining stocks are one of the most compelling investment opportunities of the next decade thanks to extreme undervaluation, widespread investor neglect, and surging profitability.

Regular readers of this newsletter know that I’ve been extremely bullish on gold, and also on gold mining stocks. I frequently highlight gold mining stock ETFs in my updates, including back in April when I pointed out that they had broken out of a major long-term chart pattern and were beginning a significant bull market. While they’ve moved sideways in recent months alongside gold’s consolidation, they are now heating up again. That’s why I’ve written this in-depth report outlining the compelling bullish case for gold mining stocks, including the fact that they remain quite undervalued and have substantial upside potential ahead.
Before diving into the gold mining sector, I want to begin by revisiting my long-term bullish thesis for gold itself, which I outlined in a detailed must-read report a few months ago. In summary, I believe gold is on track to reach at least $15,000 per ounce within the next five to ten years. This outlook is based on a powerful combination of bullish technical factors, ongoing fiat currency debasement, persistent inflation, unsustainable global debt levels, and dangerous bubbles in assets such as U.S. housing and equities.
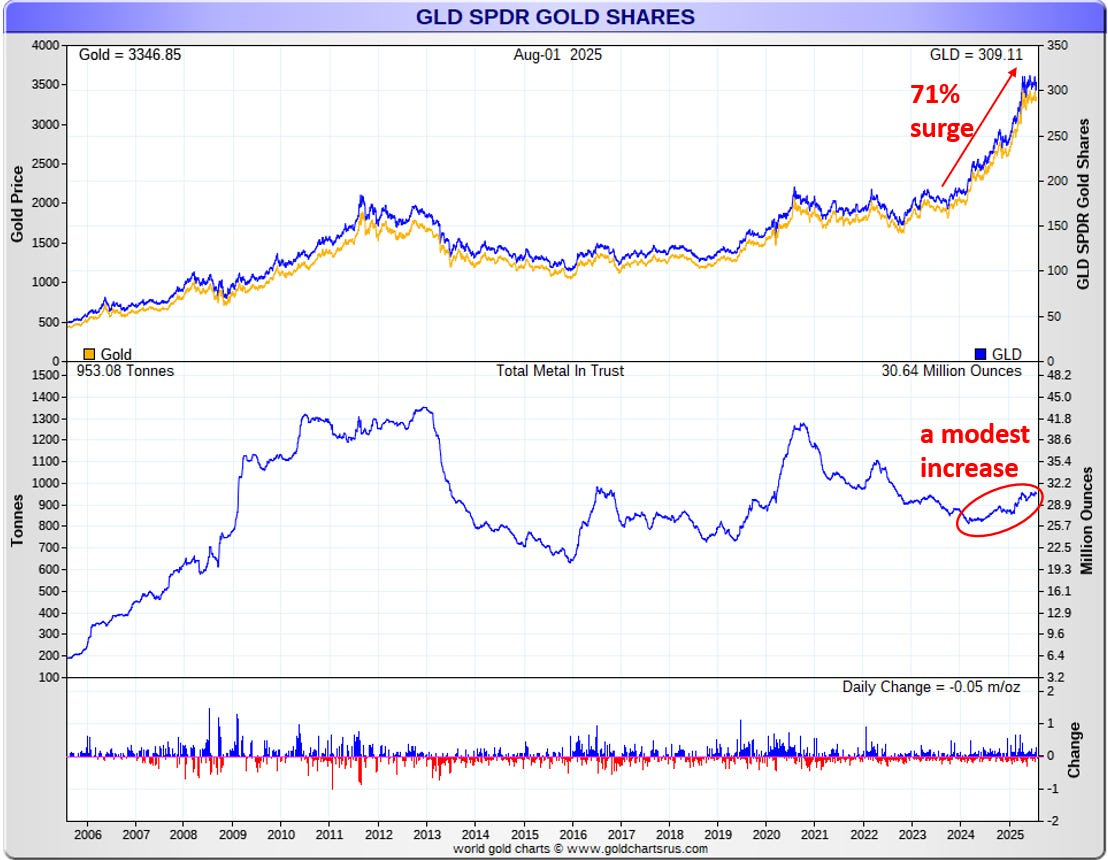
Given these conditions, I believe gold’s 71% surge over the past 17 months is merely the beginning of a much larger and longer-lasting bull market. For those looking to accumulate gold, it is far from too late. This long-term bullish thesis also strongly supports a major upside case for gold mining stocks.
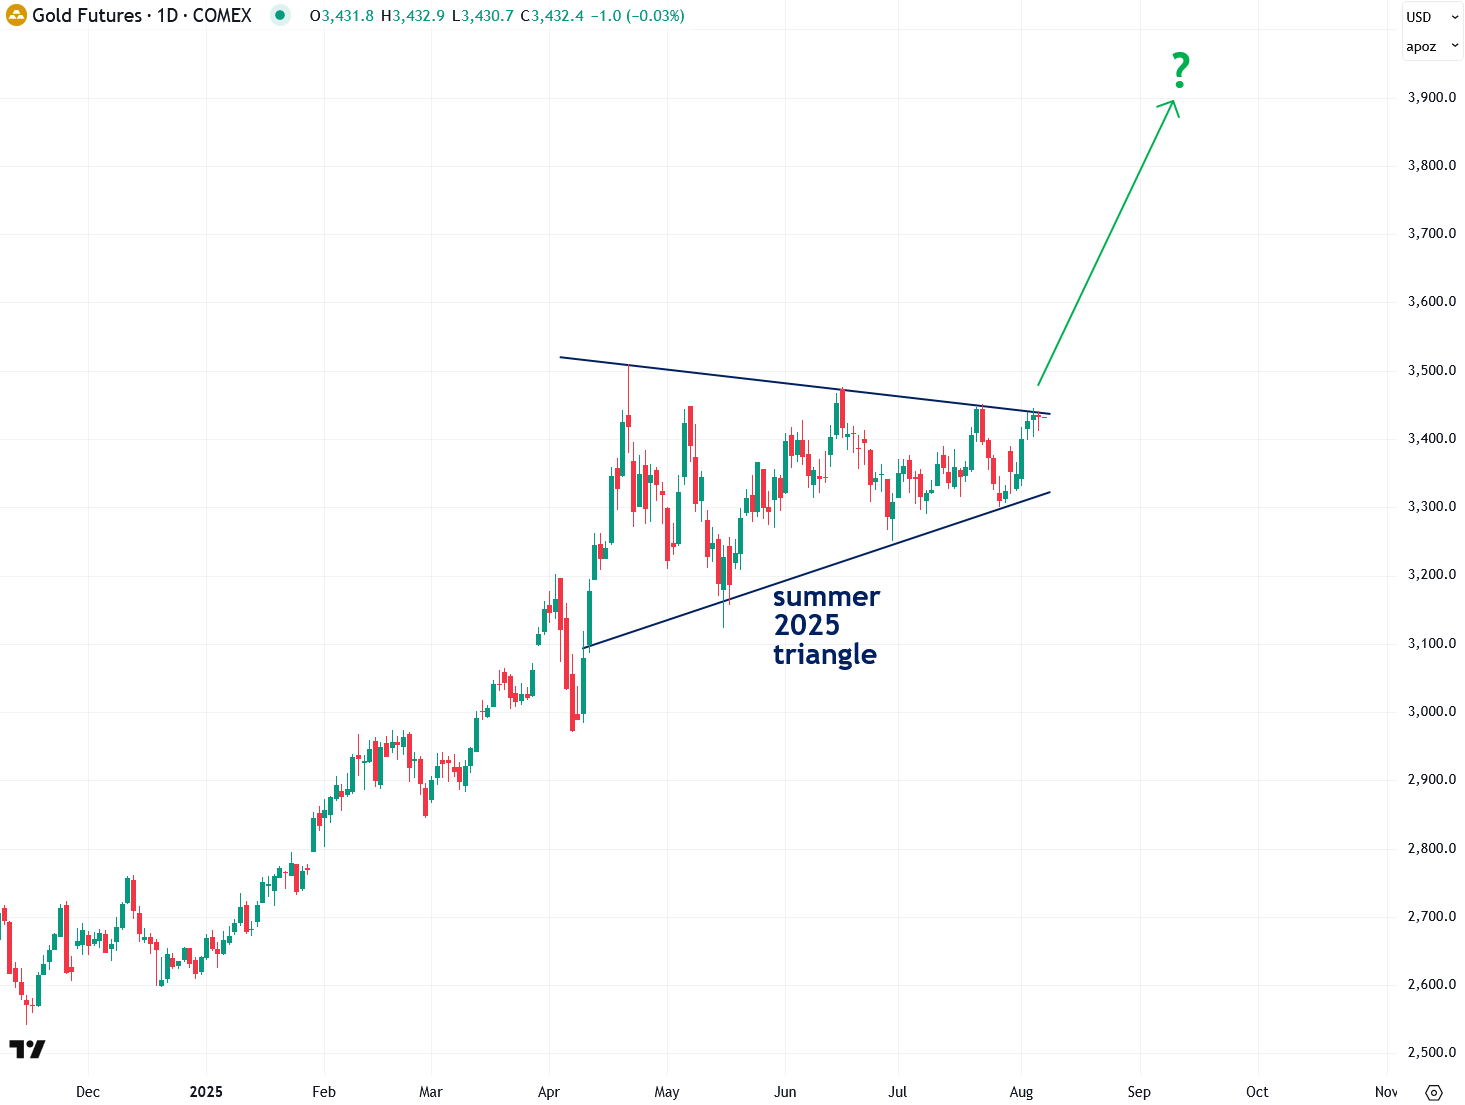
In the shorter term, I see a potentially very bullish setup developing in gold, which I detailed just a few days ago. A triangle pattern has formed over the past few months as gold has consolidated and taken a healthy breather. My view is that if gold decisively breaks out of this pattern, it should quickly surge to approximately $4,400 per ounce. Such a move would create a powerful tailwind for gold mining stocks as well.
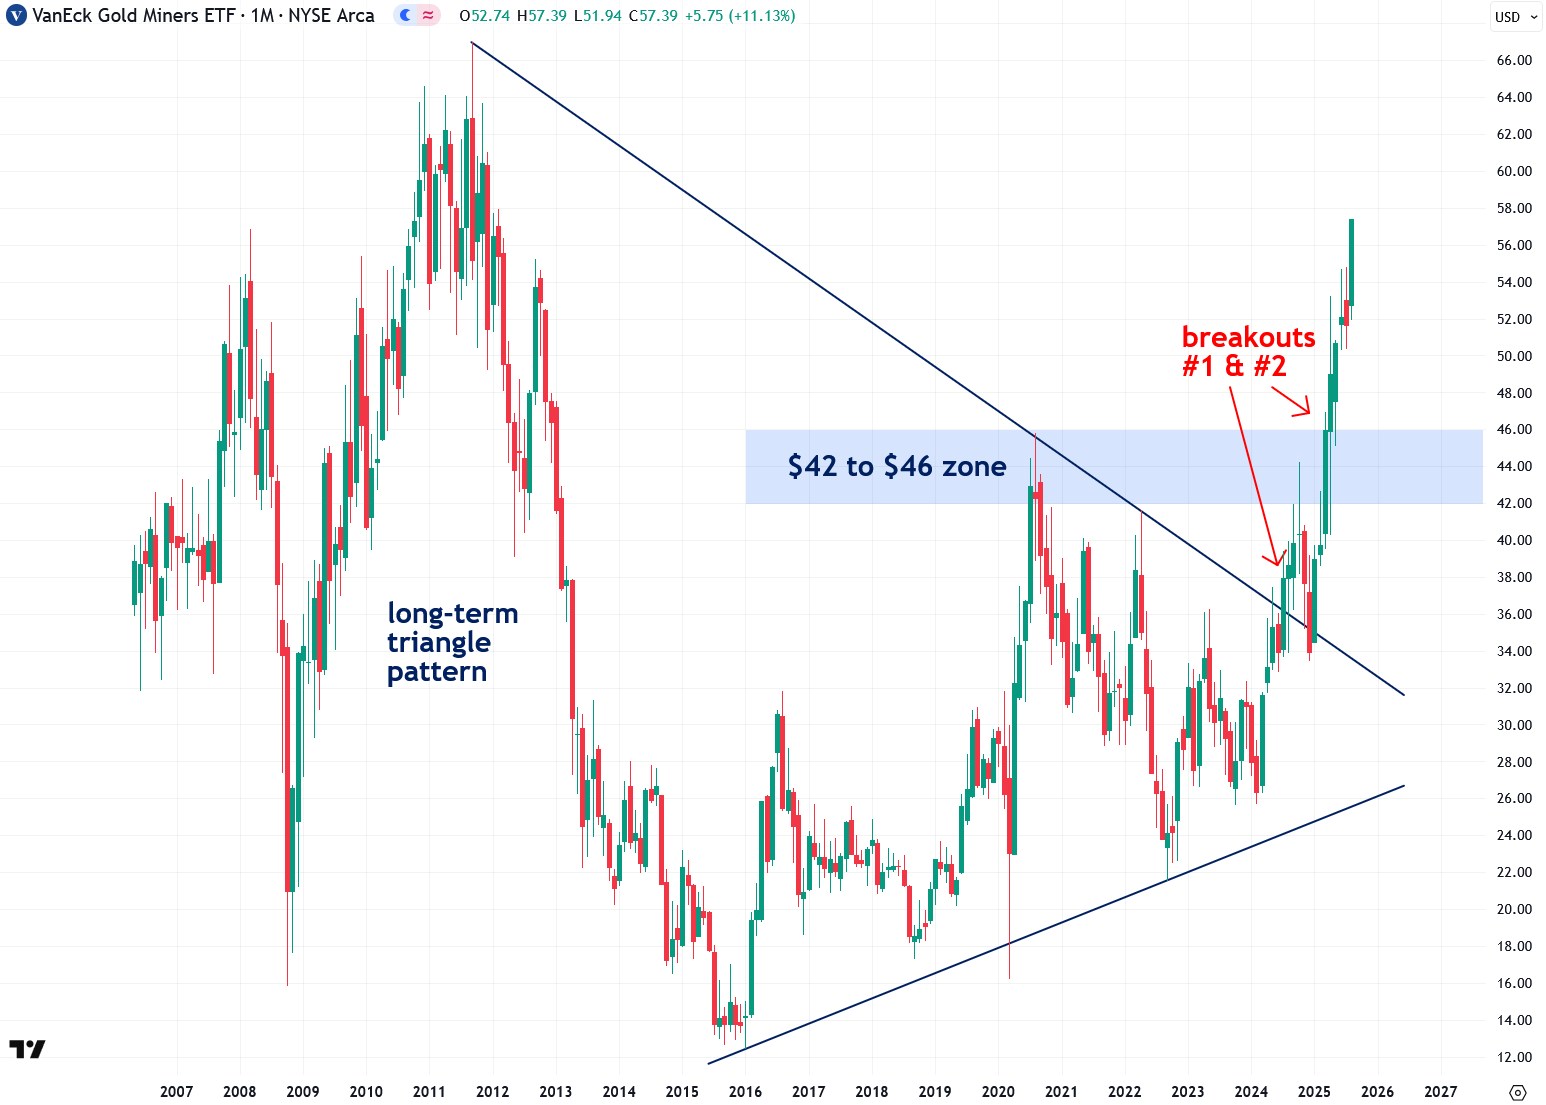
Next, I want to highlight the VanEck Gold Miners ETF, which trades under the symbol GDX. It is the most widely followed gold mining stock ETF and serves as a key proxy for large-cap gold miners such as Newmont Corporation (NEM), Agnico Eagle Mines Limited (AEM), Wheaton Precious Metals (WPM), and Barrick Gold Corporation (ABX).
The daily chart of GDX below shows that it formed an ascending triangle over the past few months and has broken out of it in the last two trading sessions. This breakout is a highly bullish signal, especially when viewed in the context of the longer-term technical setup, which I’ll highlight in the next chart.
The chart below shows the monthly chart of GDX, which reveals a long-term triangle pattern that had been forming since 2011. GDX first broke out of this pattern in July 2024, signaling the official start of the mining stock bull market. It later cleared a major horizontal resistance zone between $42 and $46 in April of this year. I view this second breakout as even more significant than the first, as it provides additional confirmation and horizontal resistance levels generally carry more technical weight than diagonal ones.
The bullish price action seen over the past two trading sessions adds further confirmation that the gold mining stock bull market is gaining momentum. This recent strength reinforces the long-term trend and indicates that there is likely much more upside ahead.
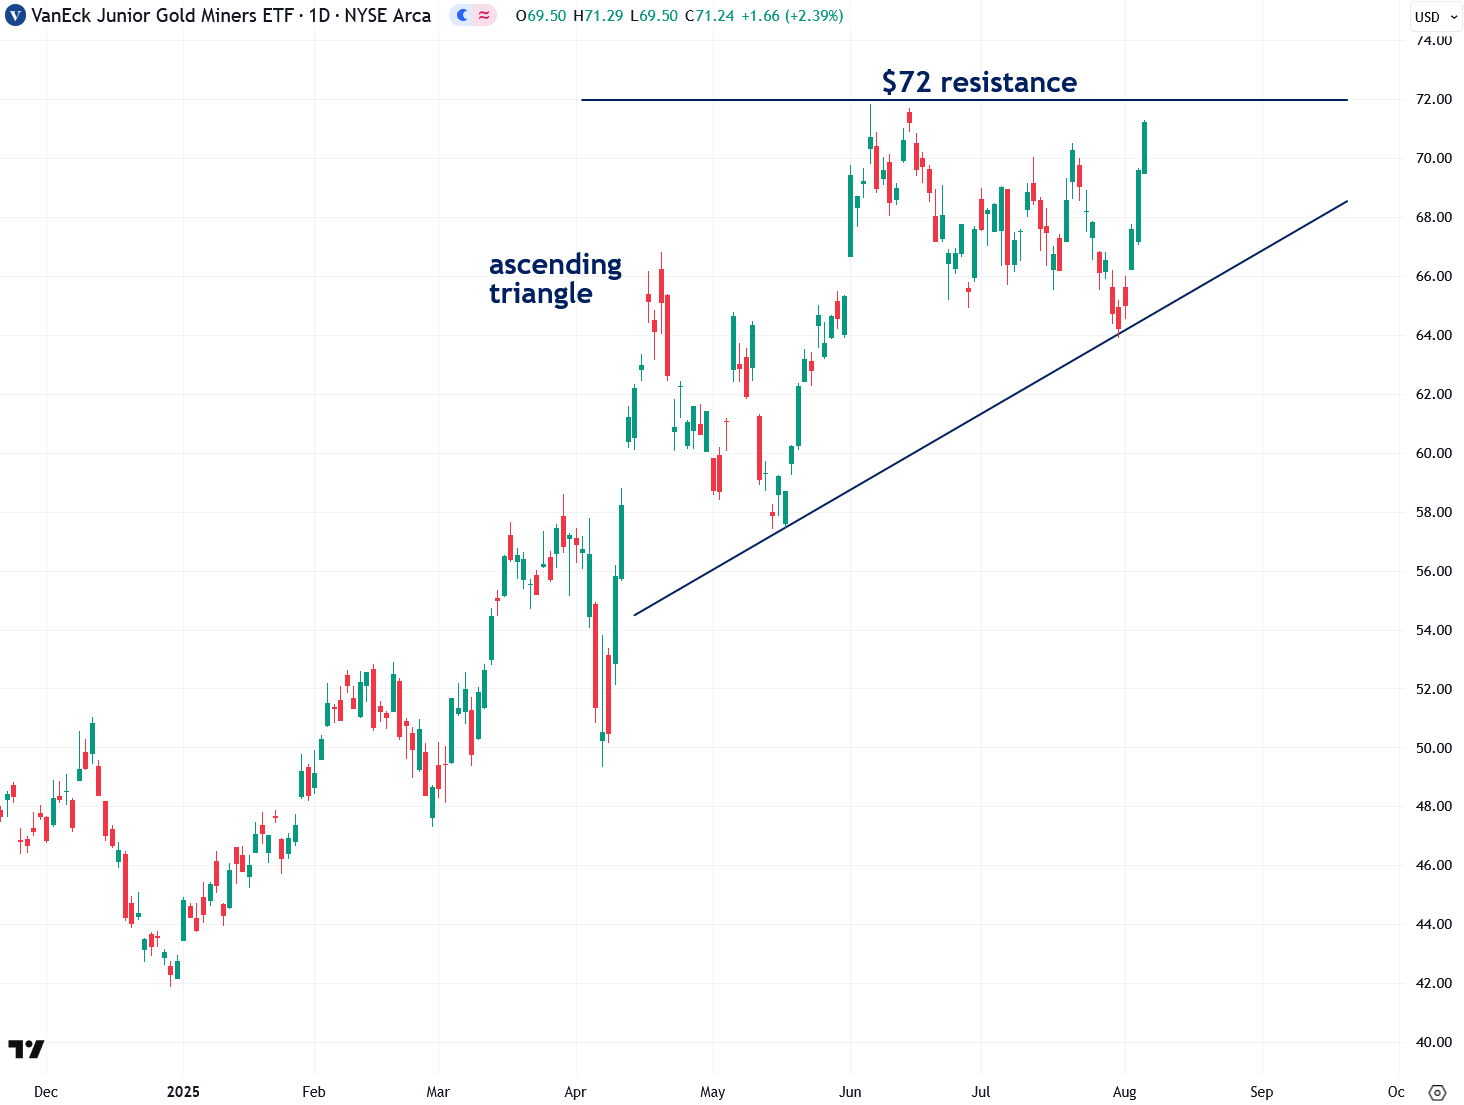
Now let’s turn to the daily chart of the VanEck Junior Gold Miners ETF, which trades under the symbol GDXJ and is the most widely used proxy for junior gold mining stocks. While the large-cap GDX has already broken out, GDXJ has yet to do so and is currently lagging behind. However, that is likely to change soon.
A bullish ascending triangle is forming in GDXJ, and a breakout above the key $72 resistance level—likely coinciding with a breakout in gold itself—would signal that the bull market in gold mining stocks is gaining strength and becoming more broad-based.
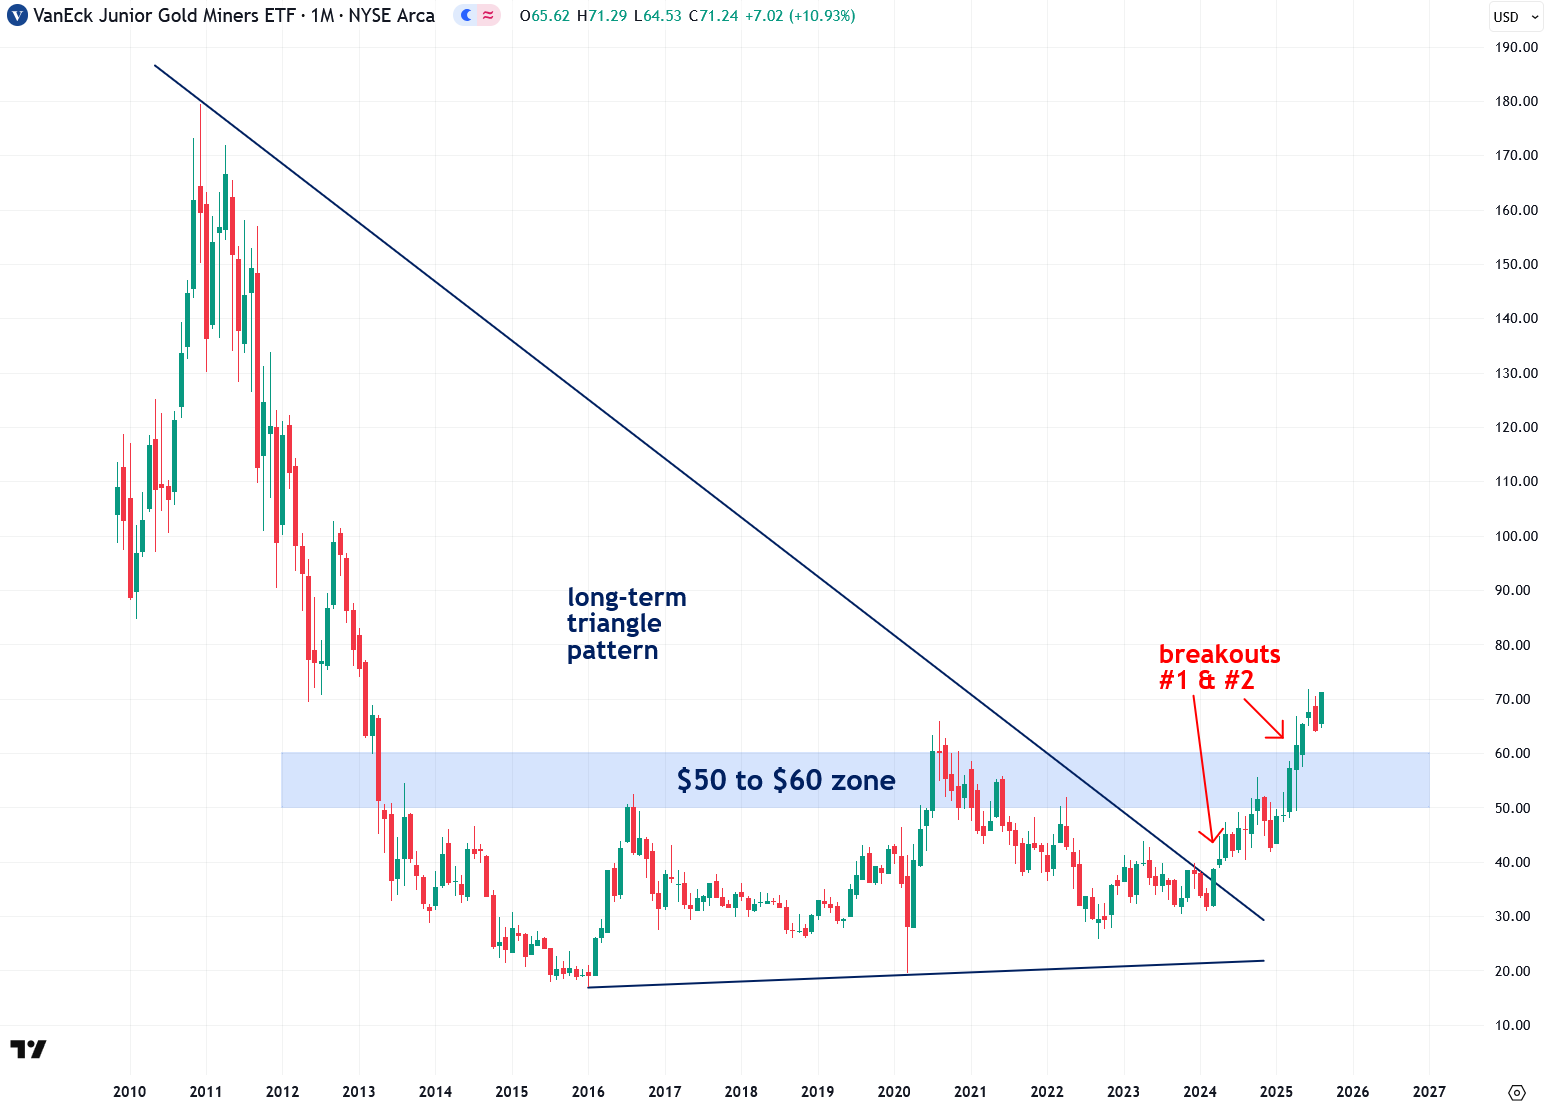
The monthly chart of GDXJ shows that, like GDX, it broke out of a long-term triangle pattern in March 2024—a formation that had been developing since 2011. This move was followed by a breakout above the key $50 to $60 resistance zone in April 2025, providing strong confirmation that the junior gold mining stock bull market is now fully underway. A breakout from the ascending triangle on the daily chart would offer even further validation.
While junior miners tend to underperform their larger peers during normal market conditions, they often deliver the highest returns when mining stock bull markets accelerate—an environment I believe we are now entering.
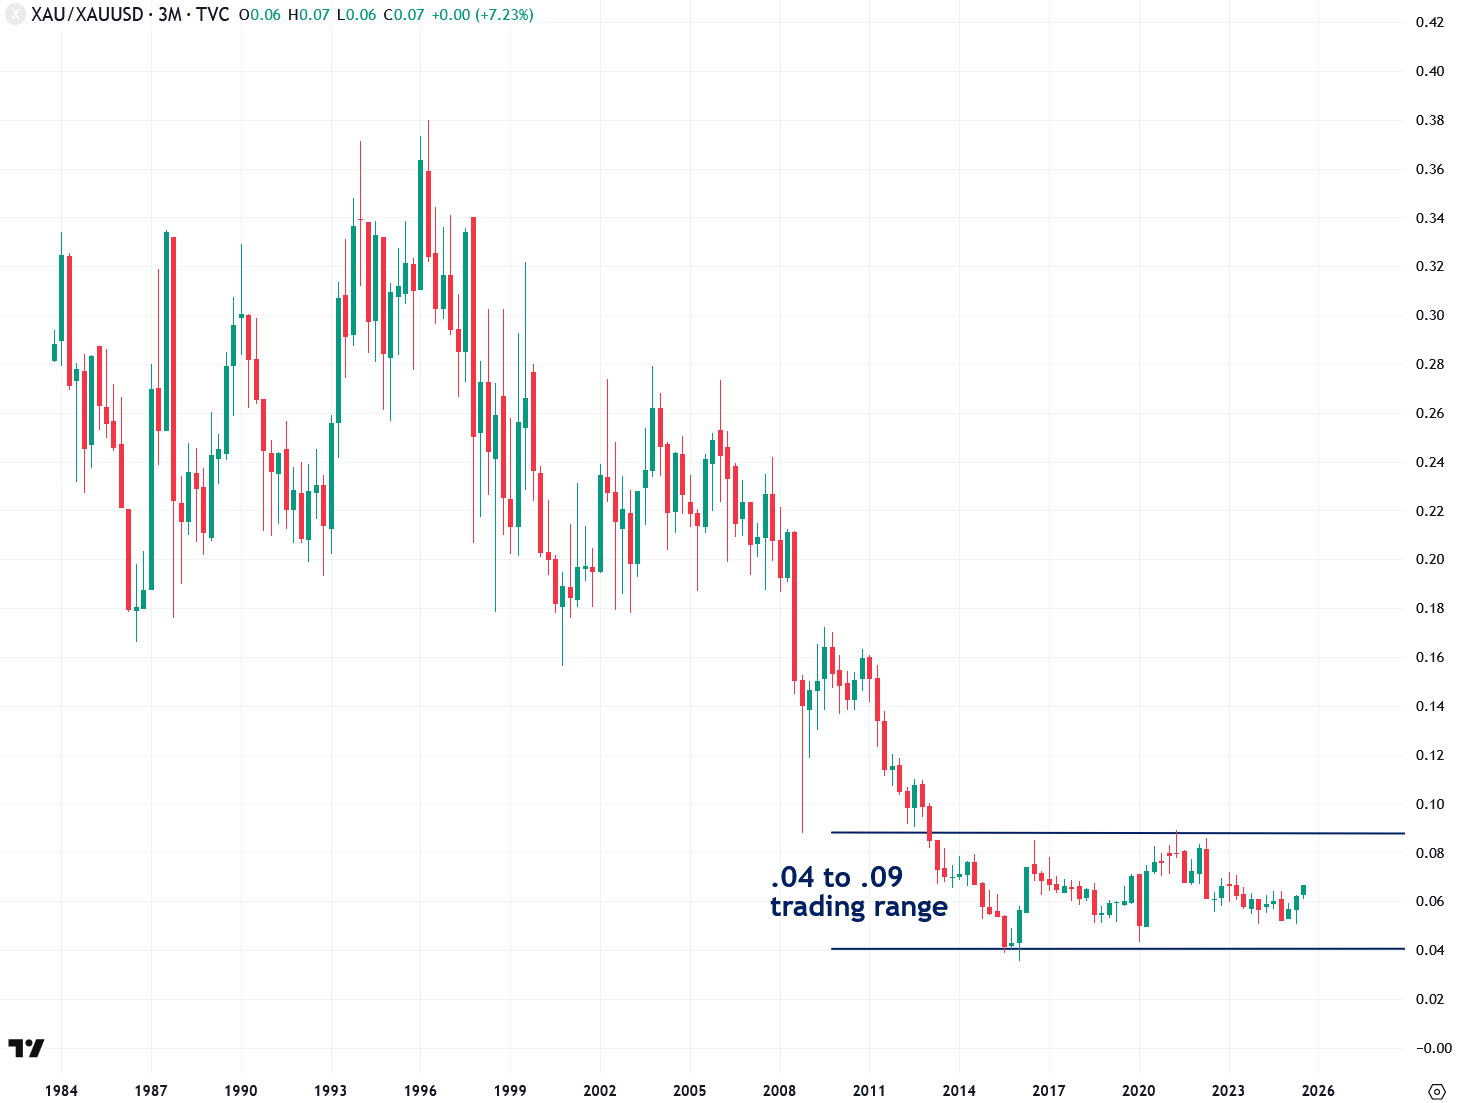
One of the key reasons I’m so bullish on gold mining stocks is how extremely undervalued they are by multiple measures—including relative to the price of gold itself. This is illustrated in the chart below, which shows the ratio of the Philadelphia Gold and Silver Index (XAU) to gold. The XAU is the oldest index of precious metals mining stocks, which is why I’m using it in this example. However, it is highly correlated with GDX, so the two can be used interchangeably for this type of analysis.
The XAU-to-gold ratio is currently sitting at just 0.07—only a fraction of its historical range between the 1980s and mid-2000s, when it averaged around 0.28. This implies that, if the ratio simply returns to its historical norm during this bull market, gold mining stocks would quadruple from current levels. And that projection doesn’t even account for any further increase in the price of gold, which I fully expect. A key sign that gold mining stock valuations are poised to take off will be a decisive breakout above the 0.09 resistance level in this ratio.
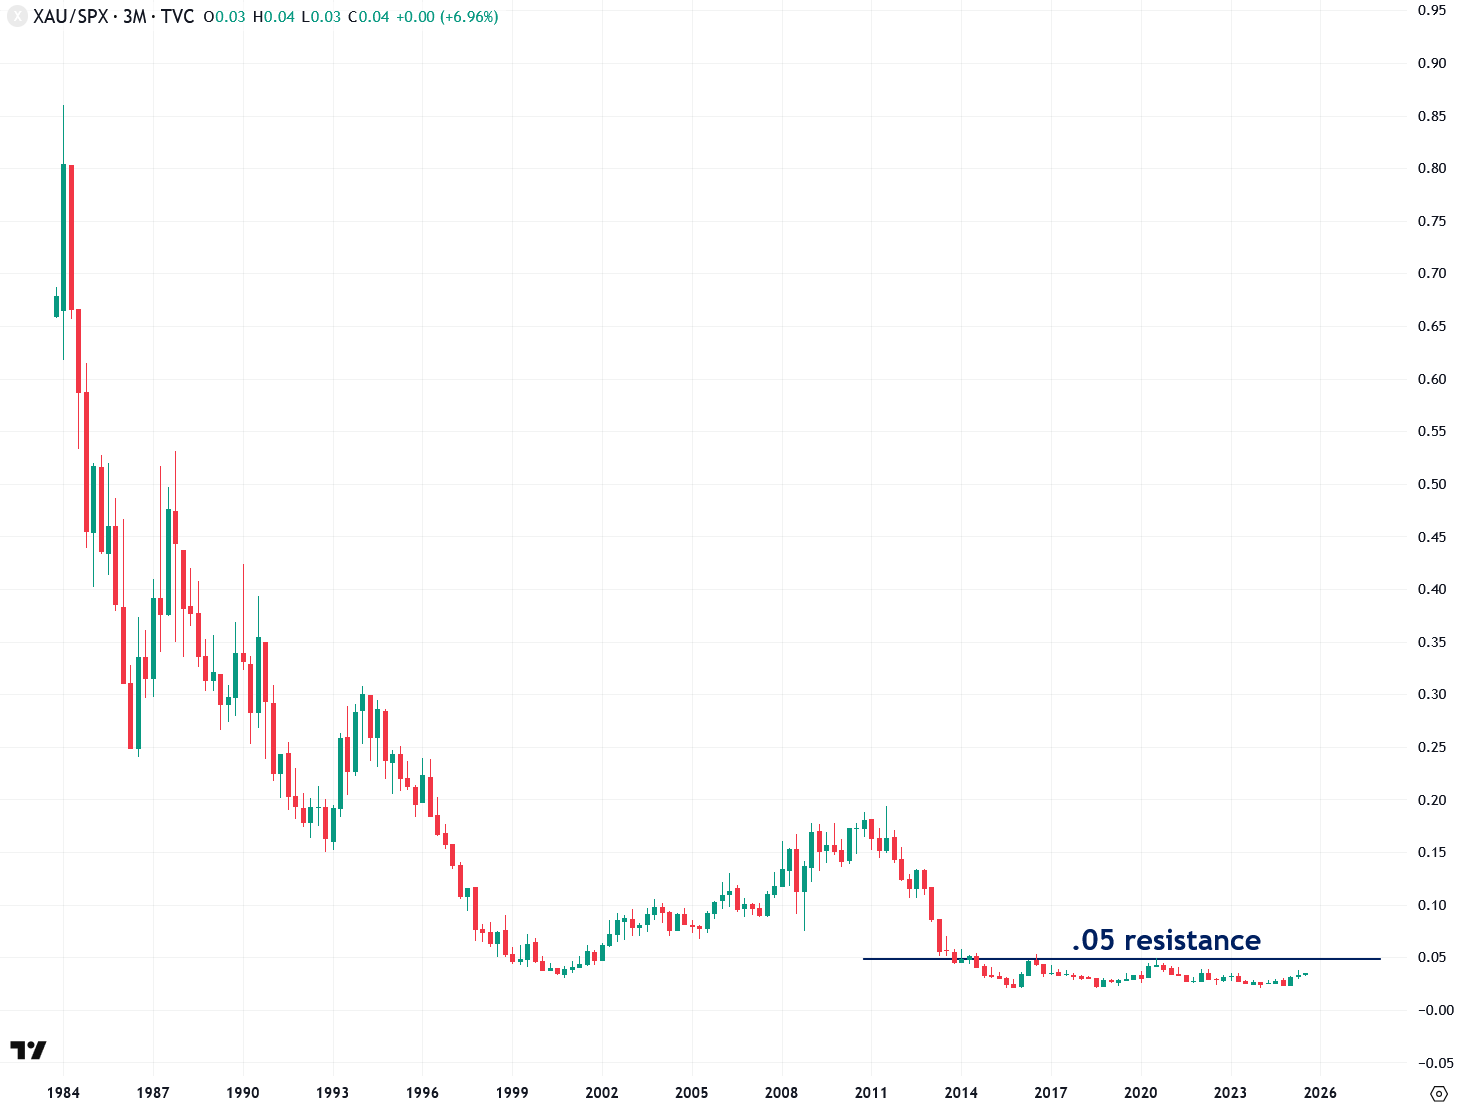
The extreme undervaluation of the gold mining sector is also clearly confirmed by the ratio of the Philadelphia Gold and Silver Index (XAU) to the S&P 500, which currently stands at just 0.04. In the late 2000s, this ratio was at least four times higher, and during the 1980s, it was ten to twenty times higher. This dramatic divergence reflects a combination of deeply undervalued gold mining stocks and a historically overvalued U.S. stock market—an issue I’ll explore in more detail later in this report.
Regardless of the cause, the implication is the same: there is significant upside potential for gold mining stocks. A key sign that this revaluation is beginning will be a decisive breakout above the 0.05 resistance level in this ratio.
So why have gold mining stocks lagged so far behind the price of gold—even during the powerful bull market that began in early 2024? There are several reasons, but one of the most important is that the recent surge in gold has been driven primarily by central banks and Asian investors, with relatively little participation from Western, and especially American, investors until quite recently.
While gold is traded globally, most gold mining stocks are listed in the United States and Canada, where investor sentiment toward gold has remained muted for much of this bull market. This disconnect has kept mining stocks trading well below where you might expect, given gold’s strength.
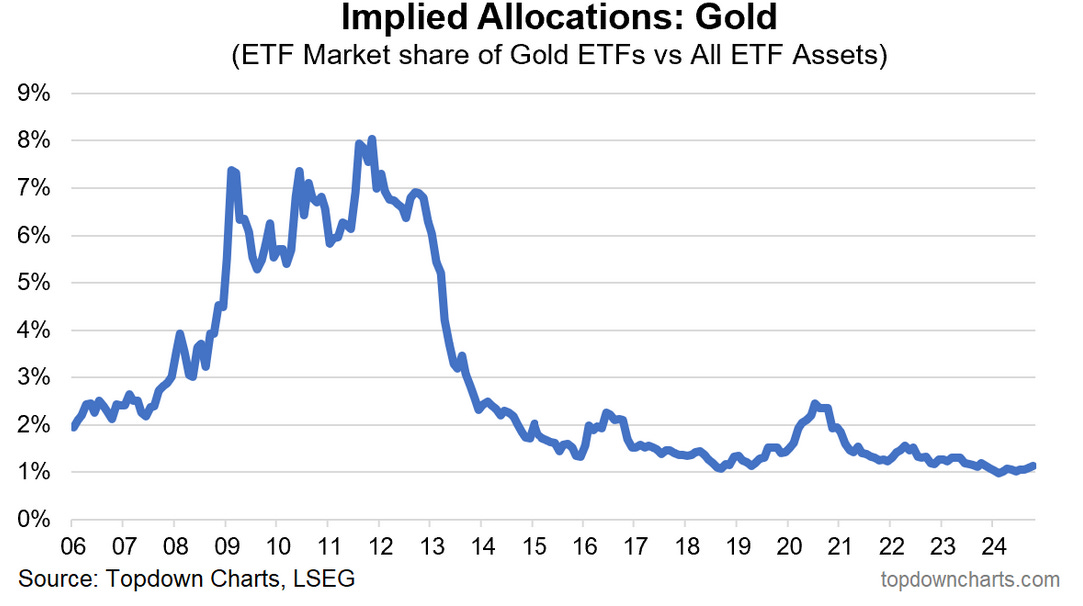
This dynamic is evident in several ways, including the implied portfolio allocation to gold—measured by the market share of gold ETFs relative to total ETF assets—which is currently just a fraction of what it was in the late 2000s and early 2010s (chart courtesy of Topdown Charts):
Another example of this dynamic can been seen in the SPDR Gold Shares (GLD), the most popular American gold ETF and a widely used proxy for U.S. investor interest in gold. Although the current gold bull market has been underway for a year and a half, GLD’s holdings have increased only modestly, rising just 16% to 953 tonnes. This remains well below the 2012 peak of approximately 1,350 tonnes, when gold was trading about 42% lower near the $2,000 level.
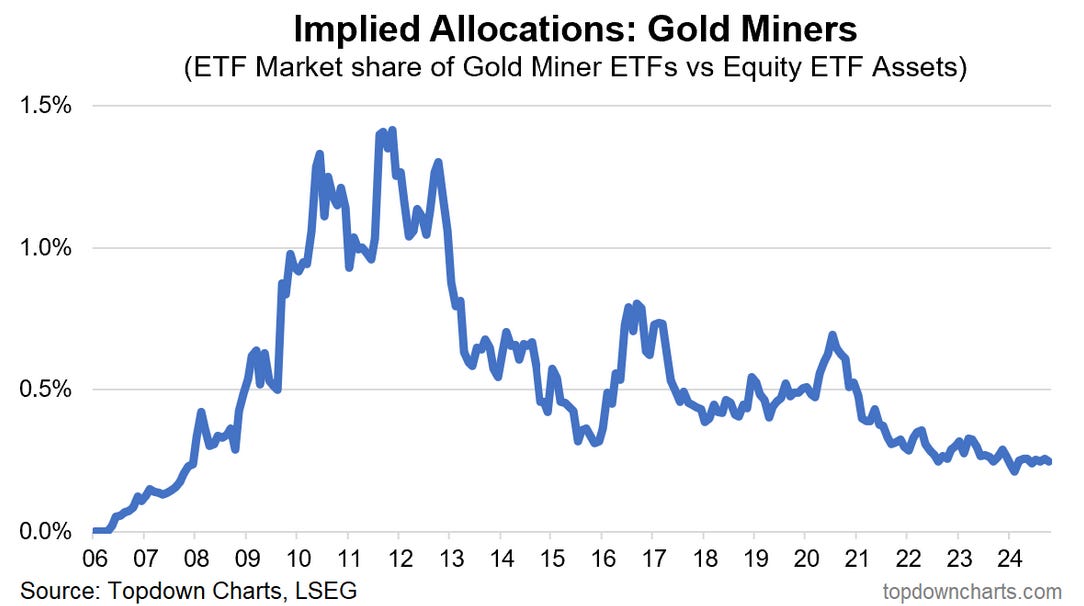
The lack of Western investor interest in gold mining stocks is also clearly reflected in the implied portfolio allocation to gold mining ETFs relative to equity ETFs. My purpose in highlighting this isn’t to sound negative or discouraging, but to emphasize how much upside potential still exists in the sector. As Western investors eventually begin to recognize the opportunity and increase their exposure, it will drive both gold and gold mining stocks significantly higher from current levels.
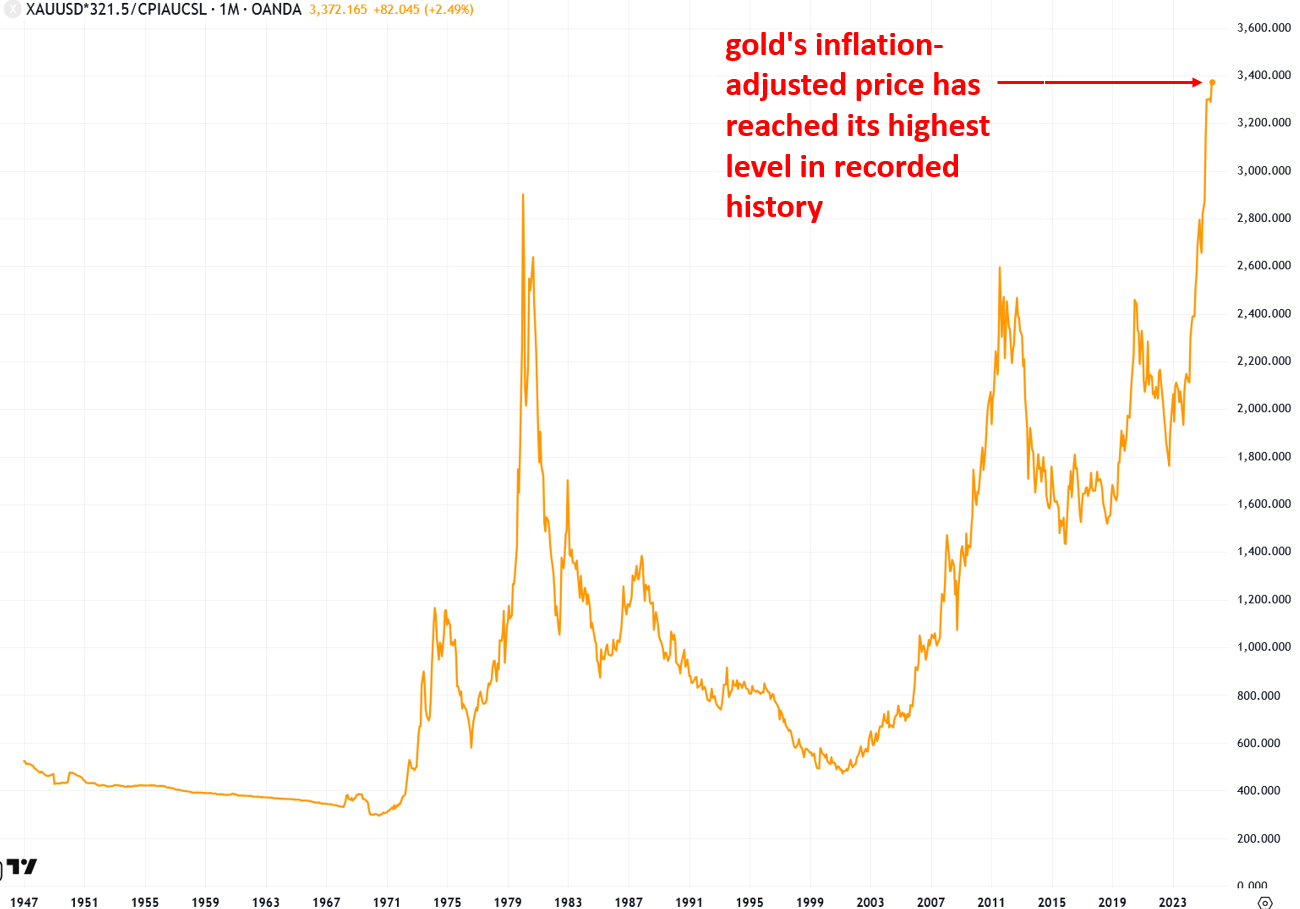
Next, I want to address another extremely bullish factor for the gold mining sector—one that is making it significantly more profitable than just a few years ago: the real or inflation-adjusted price of gold is now at its highest level in recorded history, even surpassing the spike of the early 1980s.
This is critical for gold miners because it means the price of what they’re selling—gold—is rising much faster than the costs of producing it, which include labor, fuel, power, explosives, equipment maintenance, and chemicals. As long as the price of gold remains elevated in real terms, mining sector profitability will continue to improve. And since share prices typically track earnings closely, this creates a powerful tailwind for gold mining stocks.
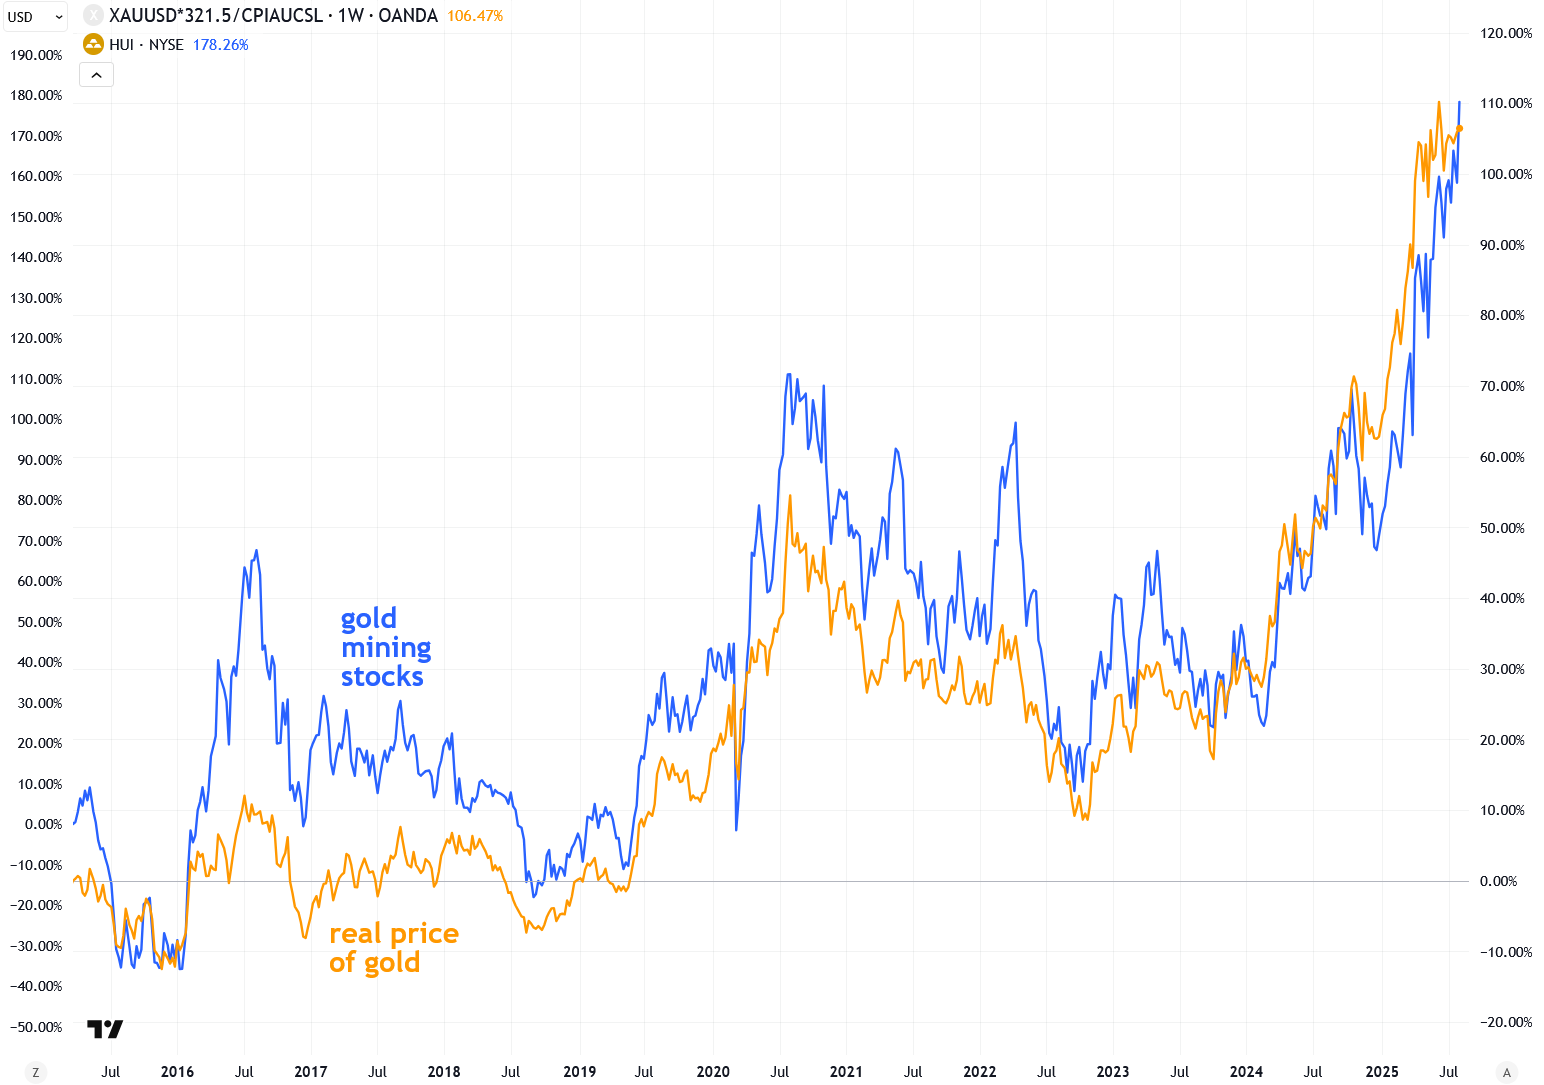
To further drive home the previous point, I created the chart below to show how closely gold mining stock prices track the real price of gold—often even more closely than the nominal price. This is because mining profitability doesn't actually improve if gold prices and production costs are rising at the same pace. It's the strength of gold in inflation-adjusted terms that truly drives margins and, in turn, stock performance.
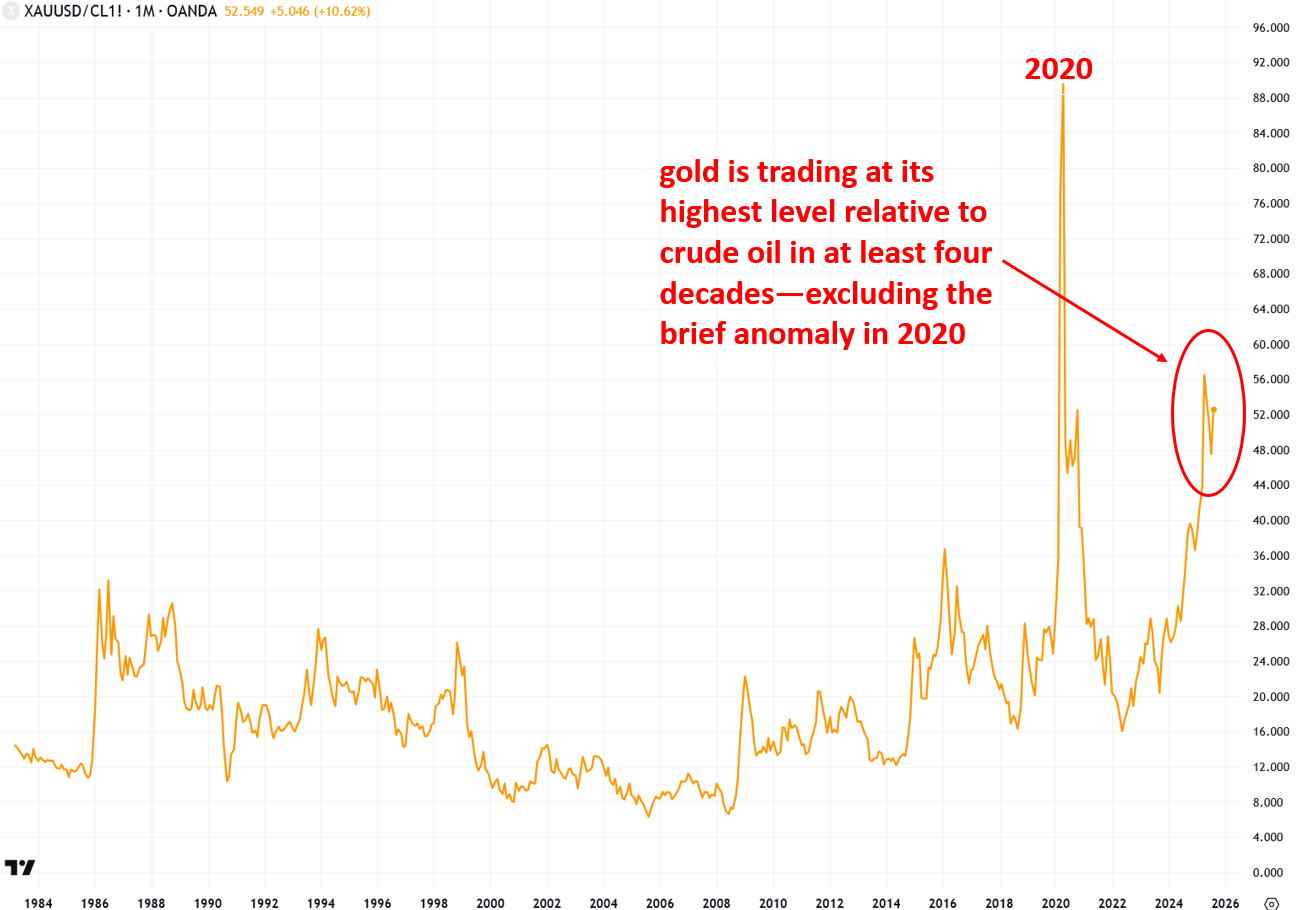
Another quick way to gauge whether we’re in a favorable profitability environment for gold miners is to look at the price of gold relative to crude oil, since energy is one of their largest operating costs. Excluding the anomalous spike in 2020, gold is now trading at its highest level relative to crude oil in at least four decades. At 52 times the price of a barrel of oil, this ratio is more than double its long-term historical average—underscoring how strong current margins are for the mining sector.
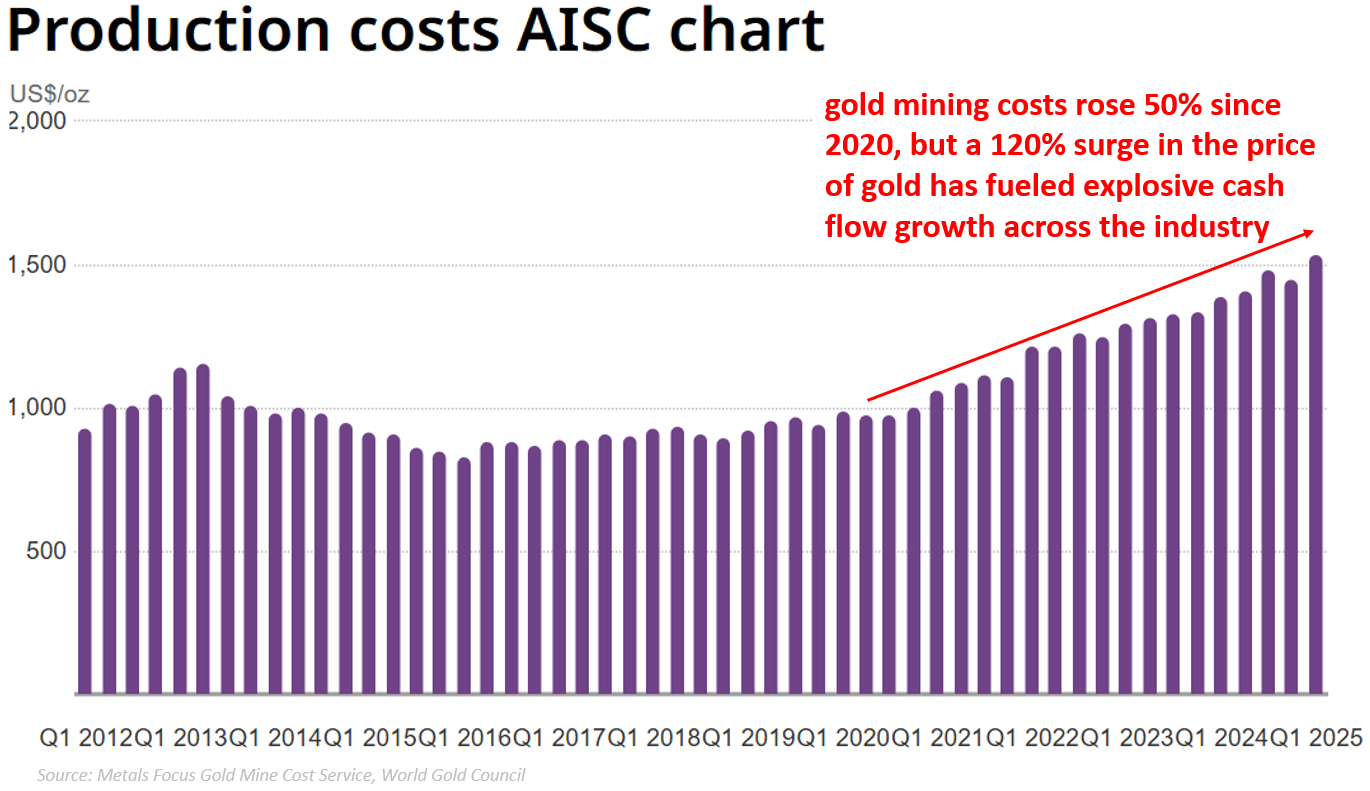
Next, a more industry-specific method for assessing gold mining profitability is to compare the All-in Sustaining Costs (AISC) to the current gold price. AISC is a comprehensive metric that includes both direct and indirect costs associated with producing an ounce of gold. Because it’s reported on a per-ounce basis, it can be directly compared to the market price of gold. The wider the gap between the gold price and AISC—with gold trading higher—the more profitable gold mining operations become.
As the chart below shows, while gold mining costs have risen by about 50% since 2020, the price of gold has climbed even more—soaring by approximately 120%. This widening gap is creating a major windfall of cash flow for the gold mining sector. To put this into perspective, in 2020 the World Gold Council reported an industry-wide All-in Sustaining Cost (AISC) of around $1,000 per ounce, while gold was trading at roughly $1,600 per ounce. That resulted in a profit margin of about $600 per ounce. (While this is a simplified view, it serves to illustrate the overall concept.)
Fast forward to 2025, and the industry-wide AISC has increased to approximately $1,500 per ounce. However, with gold now trading around $3,400, the margin has ballooned to $1,900 per ounce—more than triple the level seen in 2020. This surge in profitability is fueling a dramatic rise in cash flow across the gold mining industry. Yet, investors have been slow to catch on, as reflected in the deep undervaluation of mining shares. That disconnect is unlikely to last much longer, and as sentiment shifts, gold mining stocks should move significantly higher.
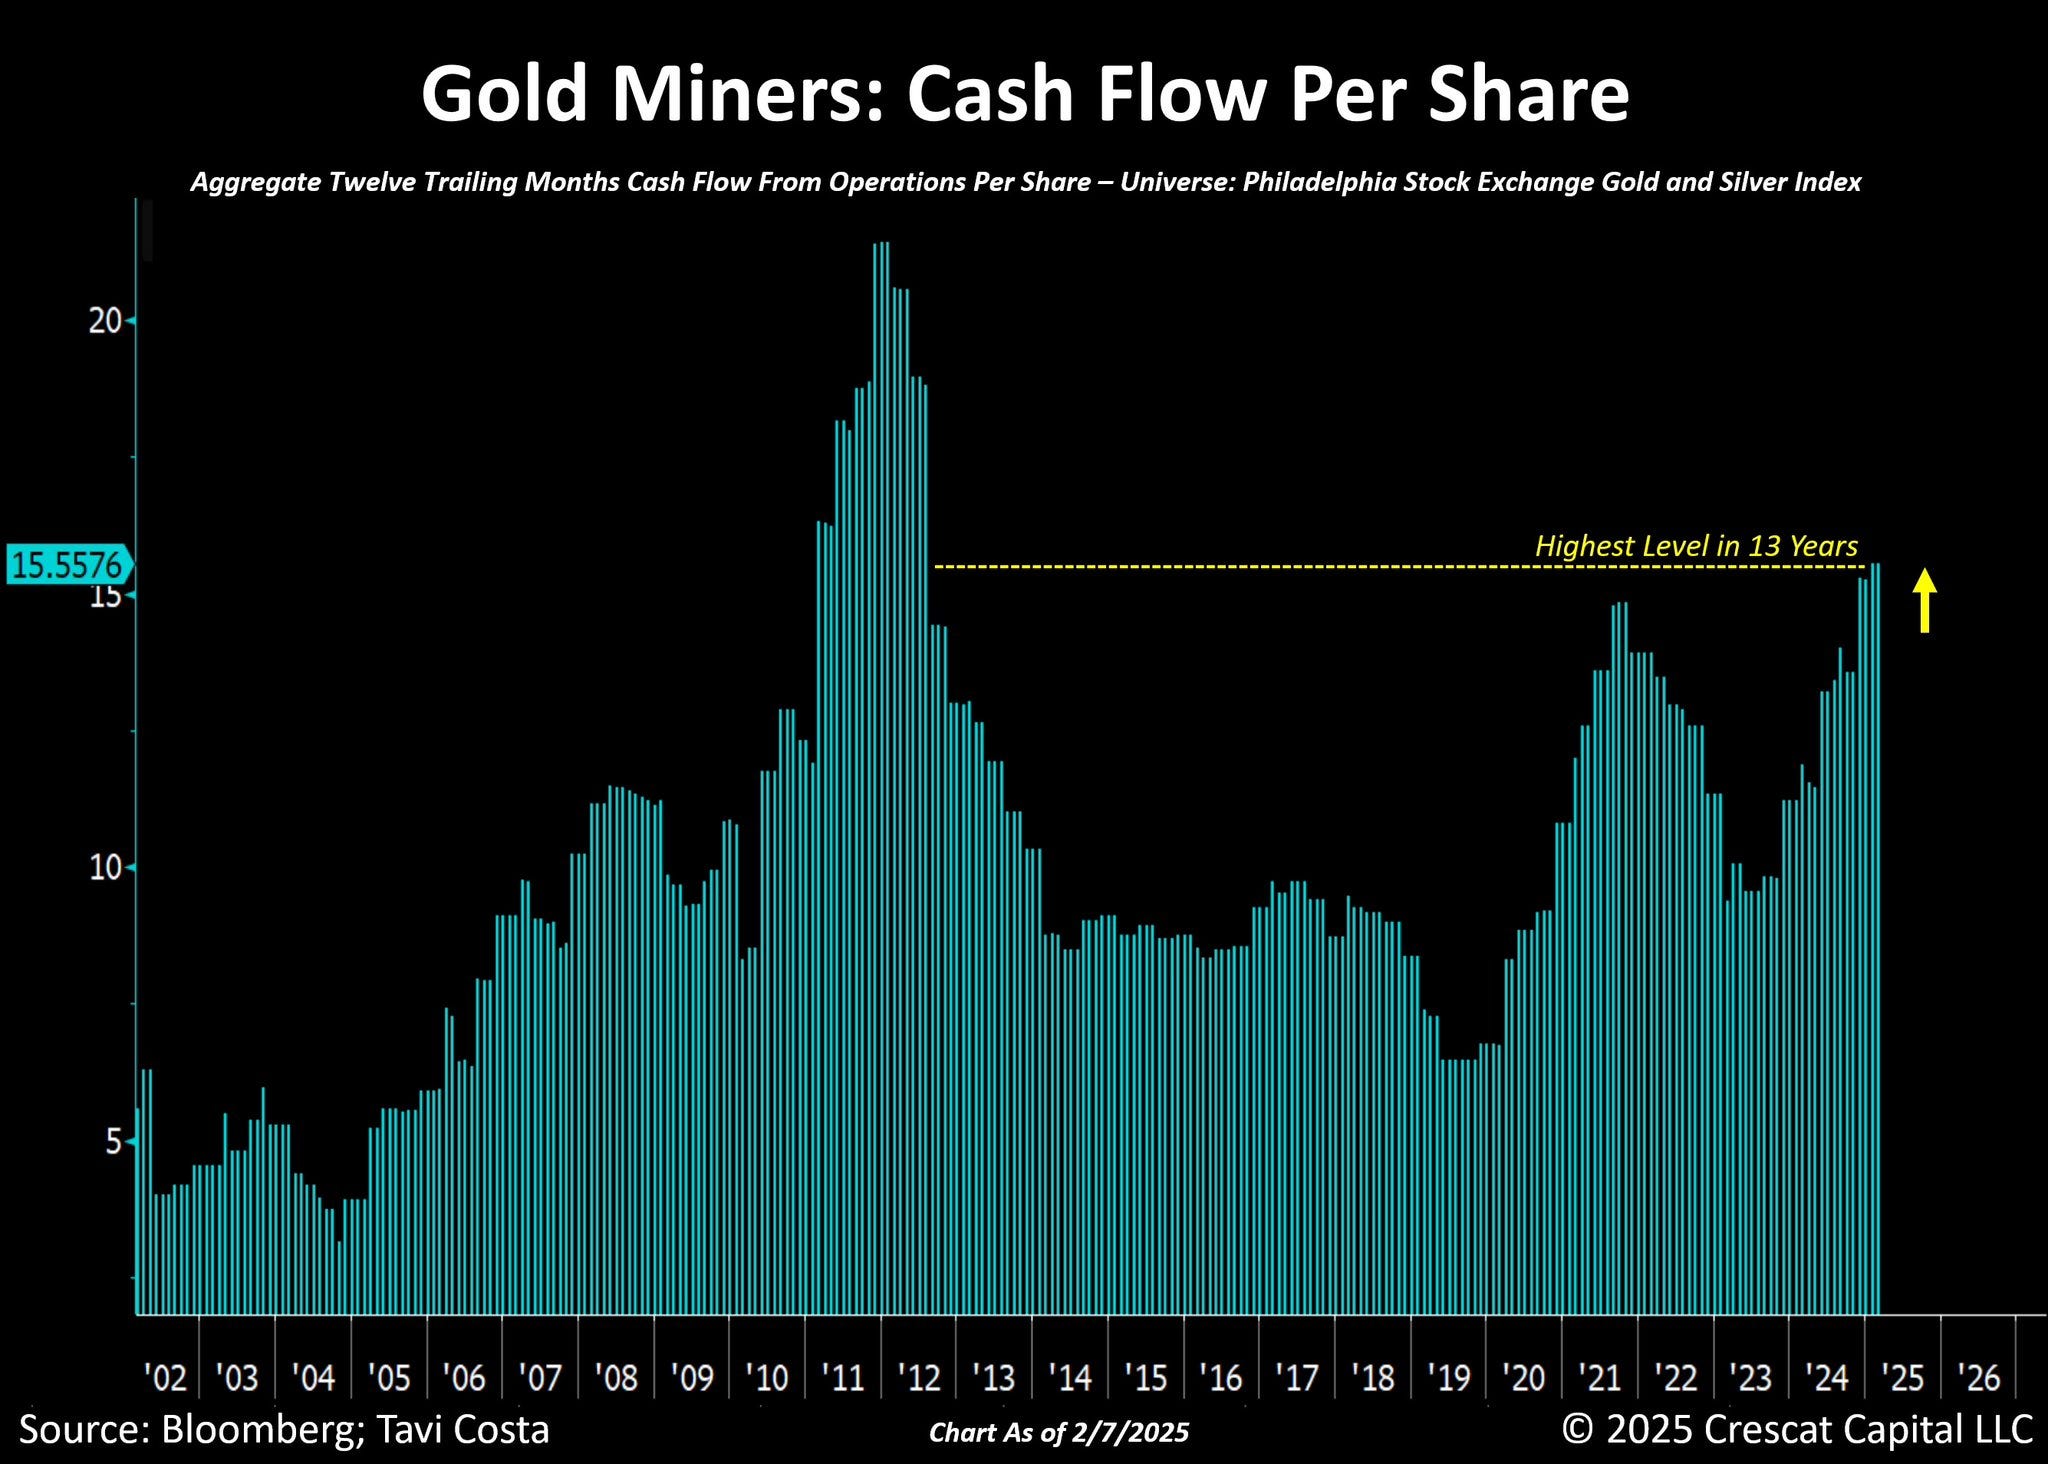
Indeed, the chart below from analyst Tavi Costa, though published earlier this year, clearly shows the surge in cash flow per share across the gold mining sector, which has reached its highest level in over thirteen years. This trend is likely to continue as long as the real price of gold stays at these elevated levels—or rises even further from here.
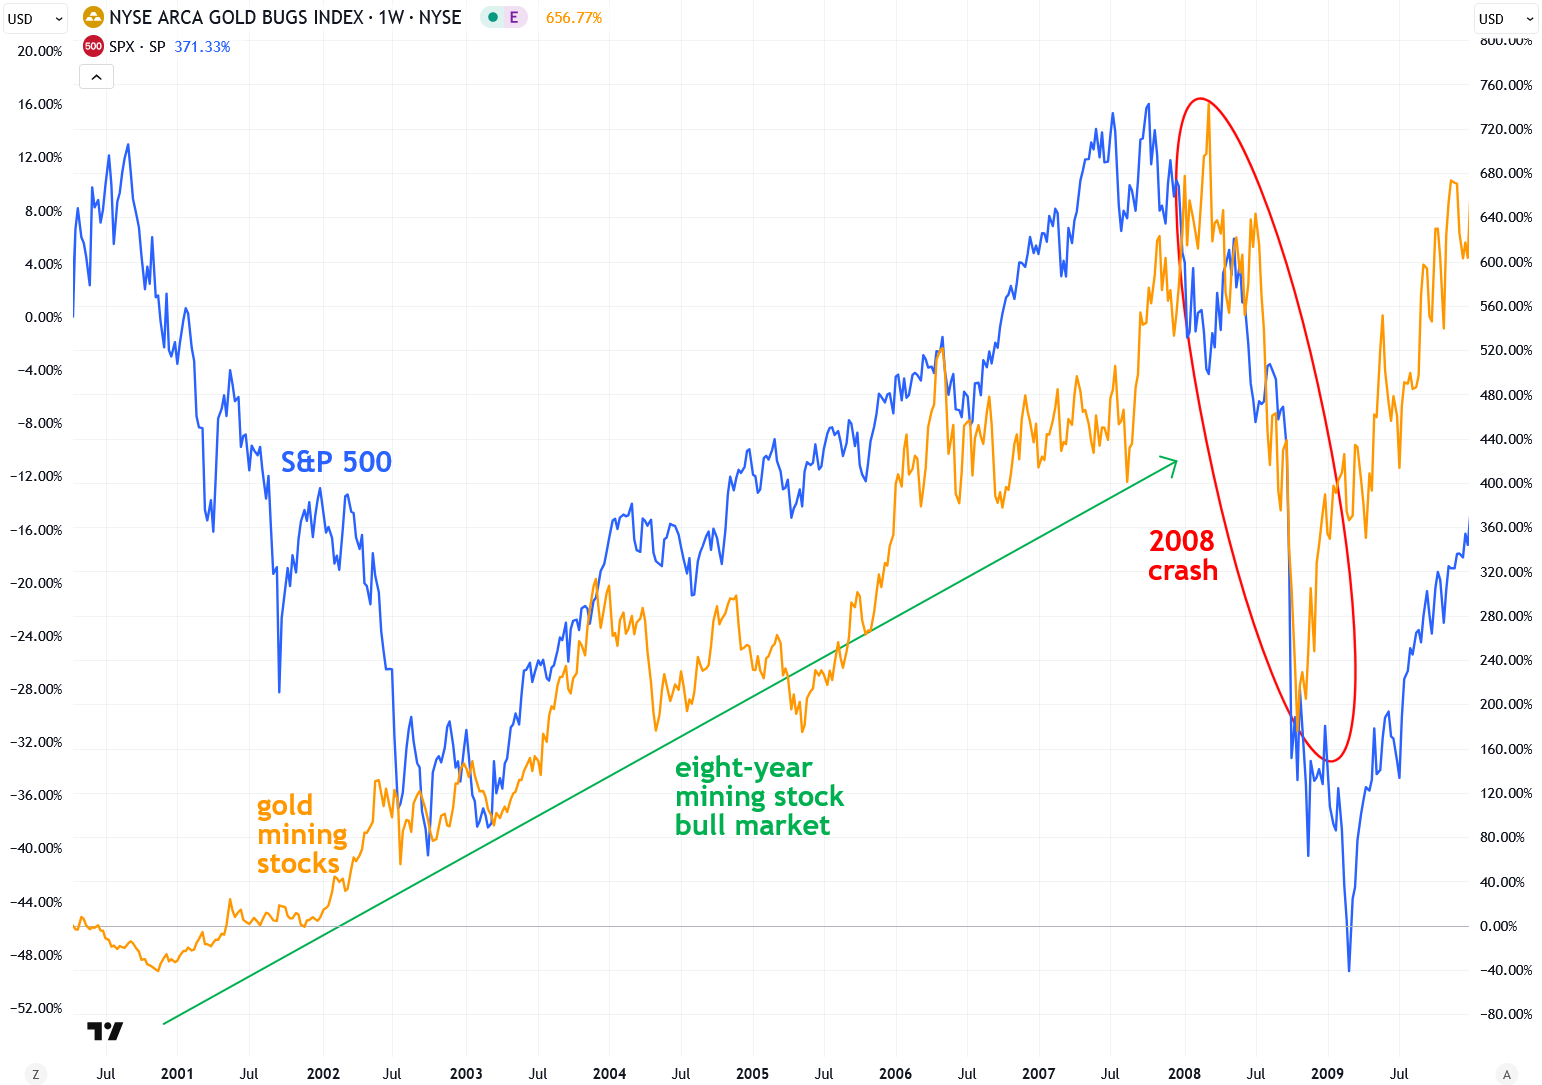
Now I want to address another key reason why investors remain so wary of gold mining stocks and why their valuations have stayed depressed: many are still shellshocked from the 2008 crash. During that period, major gold miner indices plunged by around 70%—falling in tandem with the broader market (see the chart below).
That severe drawdown shattered the widely held belief that gold miners were virtually bulletproof and would act as safe havens during times of financial turmoil. As a result, many investors who were burned in that crash now fear a repeat performance in the next bear market—and are choosing to avoid gold mining shares altogether.
While I personally lived through that crash and witnessed it unfold in real time—and yes, it was alarming—I want to explain why I don’t believe another 2008-style collapse in gold mining stocks is likely anytime soon, even though I do expect a major bear market in the broader stock market.
By the time the 2008 crash hit, gold, silver, and mining shares were already eight years into a powerful bull market. The major mining stock indices had surged more than tenfold, and the sector had attracted significant retail investor participation and attention—what traders call “weak hands.” Valuations had become inflated, and speculative enthusiasm was running high. So when the Global Financial Crisis erupted, those weak hands were quickly shaken out, triggering a steep 70% decline in gold mining shares.
What’s very different this time around is that the gold mining sector is widely ignored and, dare I say it, even hated. There is virtually no enthusiasm from mainstream investors, valuations are extremely depressed—as I showed earlier—and the current bull market in both gold and gold mining shares is still in its early stages, only about a year and a half old. These unusually low valuations serve as a strong cushion for the sector in the event of another broad stock market downturn. Unlike in 2008, there is little speculative froth to unwind, which significantly reduces the downside risk for mining stocks.
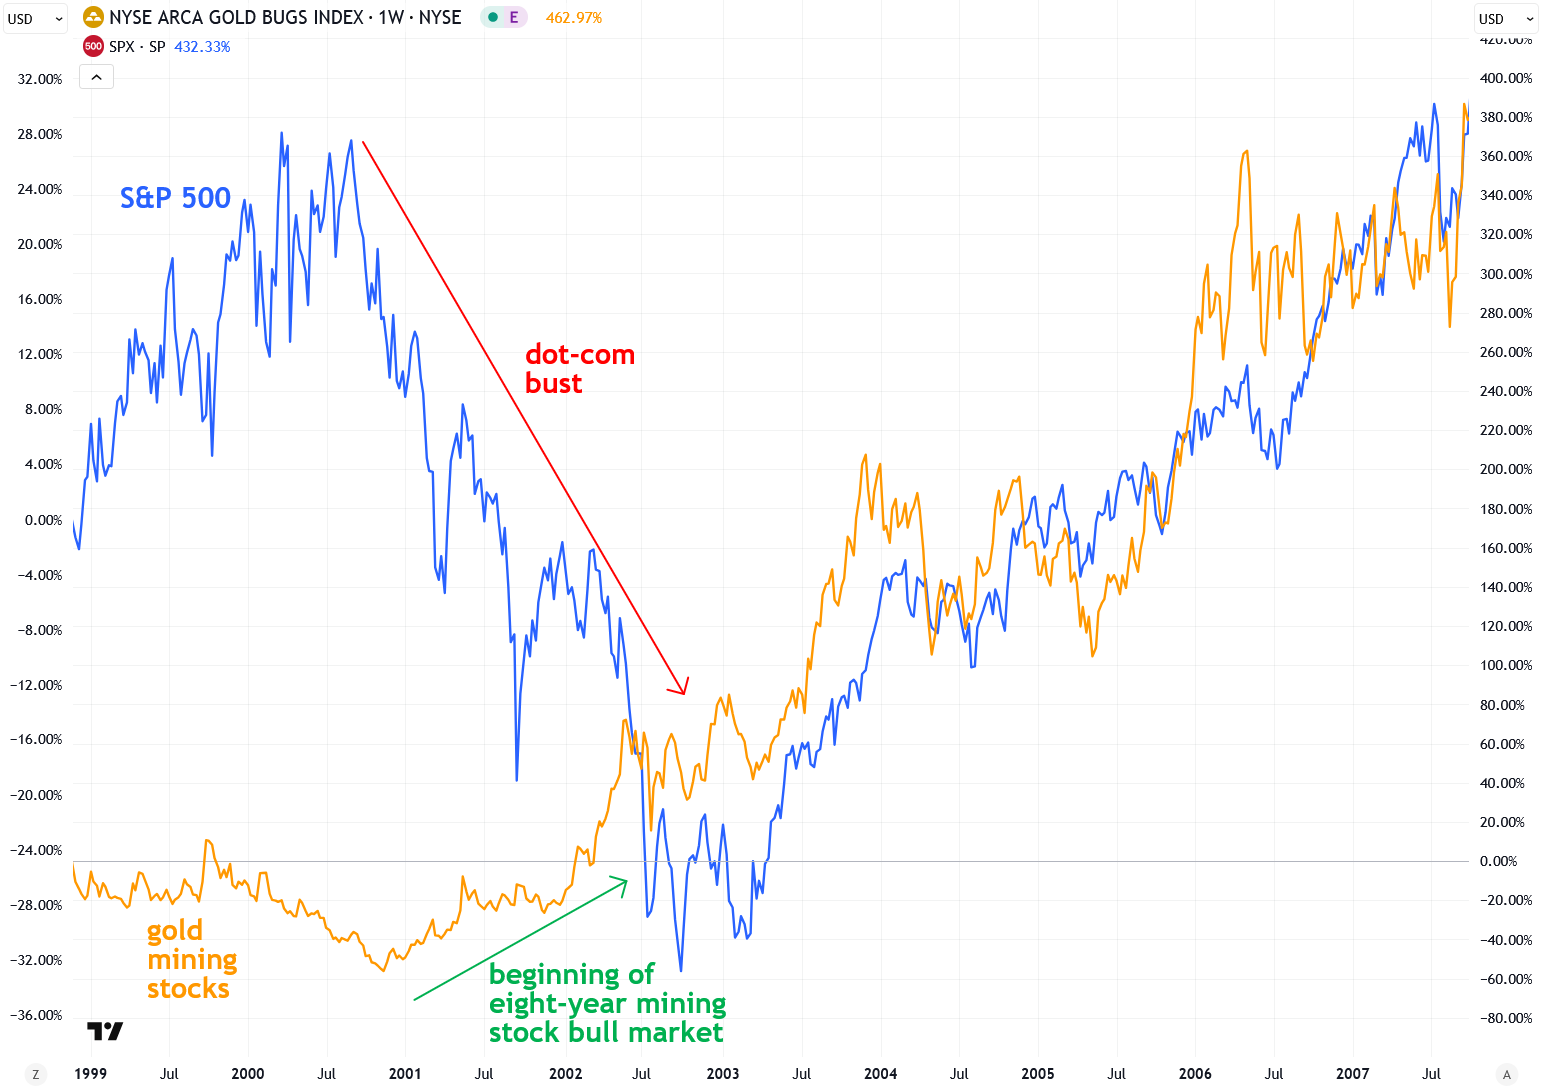
Also, contrary to popular belief, there is no rule that says gold mining stocks must plunge during a broader bear market in equities. A perfect example is the early 2000s, when the dot-com bubble burst—marking the beginning of a powerful bull market in gold mining shares (see the chart below). That wasn’t a coincidence; it was a direct result of capital fleeing the collapsing tech sector and rotating into natural resources, including gold miners.
In fact, I believe the early 2000s offer a far better comparison for today’s setup than 2007–2008. The parallels are striking: another massive tech stock bubble, extreme investor neglect of natural resource stocks, and historically low valuations across the gold mining sector. Just like in the early 2000s, I believe the tide is about to turn—and when it does, mining shares will stage an explosive move higher.
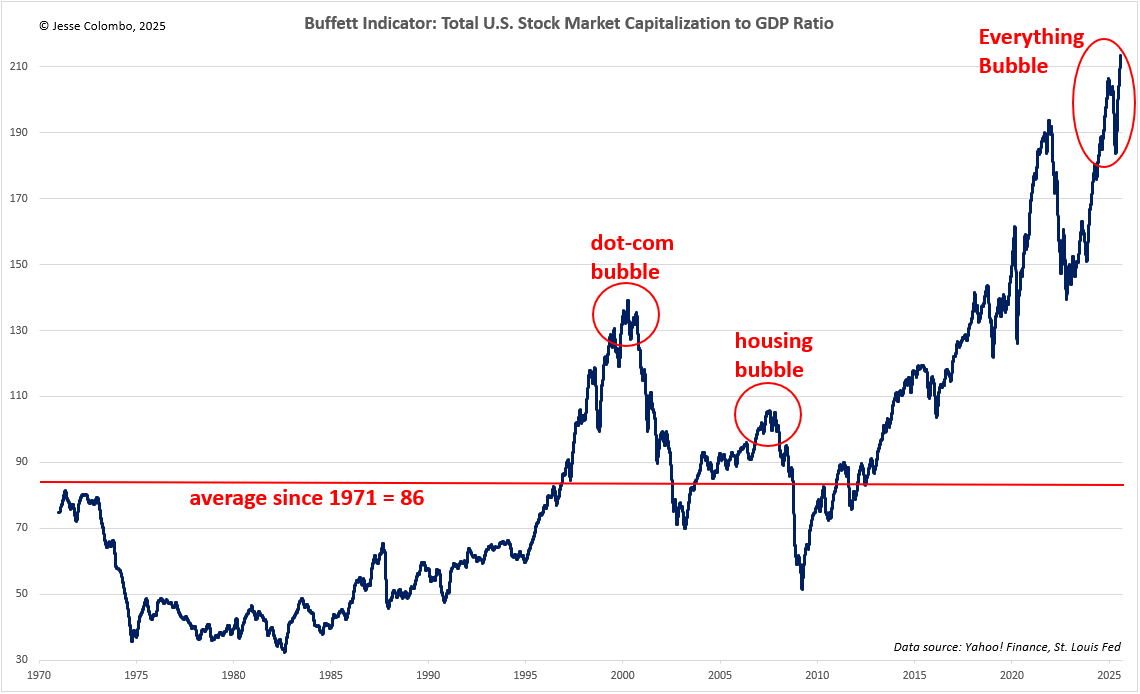
Virtually every major valuation metric confirms that the broader U.S. stock market is in the midst of a massive bubble, but the one I want to highlight today is the “Buffett Indicator.” This metric, which compares the total U.S. stock market capitalization to GDP, is a simple but highly reliable gauge of market valuation. It is named after billionaire investor Warren Buffett, who has called it “the best single measure of where valuations stand at any given moment.”
Currently, the Buffett Indicator stands at a staggering 214, which is 149% above its long-term average of 86, dating back to 1971. This level is even higher than the peak of the late-1990s dot-com bubble, which ended in a devastating crash. Buffett himself warned that when the ratio approaches 200%, investors are "playing with fire." The reason for this extreme valuation is that the stock market has surged far beyond the growth of the actual economy, a classic hallmark of speculative excess.
History has shown that valuations eventually revert to the mean, making the market highly vulnerable to a sharp and violent downturn. Given the current extremes, the risk of a major bear market is not a question of if, but when—and when it arrives, I see it propelling gold and gold mining stocks into the stratosphere. As I’ve stated earlier, I believe gold will reach at least $15,000 per ounce in the next decade.
To wrap up this report, I believe gold mining stocks represent one of the most compelling investment opportunities of the next decade—second only to physical gold and silver themselves. While these stocks are highly volatile and not suited for the faint of heart, they can be a powerful addition for experienced investors with a high risk tolerance. Personally, I view them as a valuable complement to a core holding of gold and silver bullion.
Gold mining shares are historically leveraged to the price of the metals they produce, which means they tend to outperform gold and silver during bull markets. Today, their bullish setup is driven by a combination of extreme undervaluation, widespread investor neglect, surging profitability, and the bull market in both gold and silver that is still in its early stages. I plan to publish more in-depth reports soon, including a deep dive into the silver mining sector and coverage of individual mining companies—so stay tuned.
If you’ve enjoyed this report or have any questions, comments, or thoughts, please give this post a like and share your thoughts in the comments below—I’d love to start a dialogue and hear your perspective.
Disclaimer: the information provided in The Bubble Bubble Report and related content is for informational and educational purposes only and should not be construed as investment, financial, or trading advice. Nothing in this publication constitutes a recommendation, solicitation, or offer to buy or sell any securities, commodities, or financial instruments.
All investments carry risk, and past performance is not indicative of future results. Readers should conduct their own research and consult with a qualified financial advisor before making any investment decisions. The author and publisher disclaim any liability for financial losses or damages incurred as a result of reliance on the information provided.
Thanks. Good stuff. Looking fwd to your take on silver. I’ve got a much higher percentage allocated to silver than I ever intended, close to 35% versus gold. I’ve continued used to buy silver every month even though I stopped buying gold at 2000. So even though gold has risen by 70% since then, silver has done a decent job keeping pace and I’ve just kept buying.
I’ve got some juniors that are 3 baggers. Any other equities that doubled I would have sold 1/2 my position already. Instead, I keep trying to buy more of the runners, when I can get my order filled. Two times today I tried to add more shares and the sticks just gapped up right past my bid. And then were up 10%+ from there. I’m biased but I agree with you, long way to go.
Dear Jesse, Thank you for another outstanding report on the mining stocks, which seems incredibly well researched, and also adds compelling evidence for the underlying gold and silver metals. I do subscribe to a number of precious metal analysts, and to encourage you, I find your analysis dramatically better than all of the work of the other very well known analysts put together! Whilst I totally agree with your excellent analysis concerning the mining stocks, I do not personally own any myself, since I am very heavily invested in the physical metals, and also short the USD separately. ( I do NOT necessarily recommend that anyone shorts the USD! This is , I believe, quite risky, but I am prepared to take that risk with a relatively small part of the whole portfolio. ) I also note that you appear to be completely correct about counter-trend rally in the DXY ( US dollar index) and I am impressed that you correctly called this counter-trend rally as a short lived rally very early on, when a number of analysts believed that the DXY was making a major reversal! I so appreciate your excellent work, and have learned a great deal from you. You are obviously light years ahead of me in understanding these complex markets! Even after investing in precious metals for 17 years, I still consider myself an amateur! I am also very interested to hear your thoughts on the housing markets, in a future report, since I believe that you are bearish on the housing market, as I am . Locally, young people in their 30's, on two incomes, simply cannot afford a house, without considerable support from parents! The parents, in turn, often remortgage their homes to help their children, which may eventually compound the problem? The whole housing market seems to me a highly geared speculative market, ripe for collapse! Maybe BlackRock and other hedge funds will end up owning most of the housing stock, with everyone renting from them? We sold our house 19 years ago, and after meeting the chairman of a prominent US precious metals company, whilst working as an evangelist in Death Row in the Philippines! I was soon fully invested in precious metals, and have never regretted this! We rent a beautiful home, much nicer than the previous one, and we are very happy to be out of the housing market! With very best wishes, and again very many thanks, RichardBear