


Gold & Silver Look Ready to Rock and Roll
Learn why precious metals could be entering a stronger, more explosive phase of their bull market.

The financial markets were all over the place today, with stocks swinging back and forth without a clear direction. The session opened on a positive note after a benign U.S. Consumer Price Index (CPI) report showed core inflation rising just 3.1% in February, lower than expected. This initially lifted stock indices, but the rally quickly faded as selling pressure took over, signaling market weakness and hesitation to rebound after recent declines. Amid the uncertainty, gold and silver stood out as bright spots, gaining 0.89% and 1.8%, respectively, and moving toward a key technical breakout that could mark the next leg of the precious metals bull market.
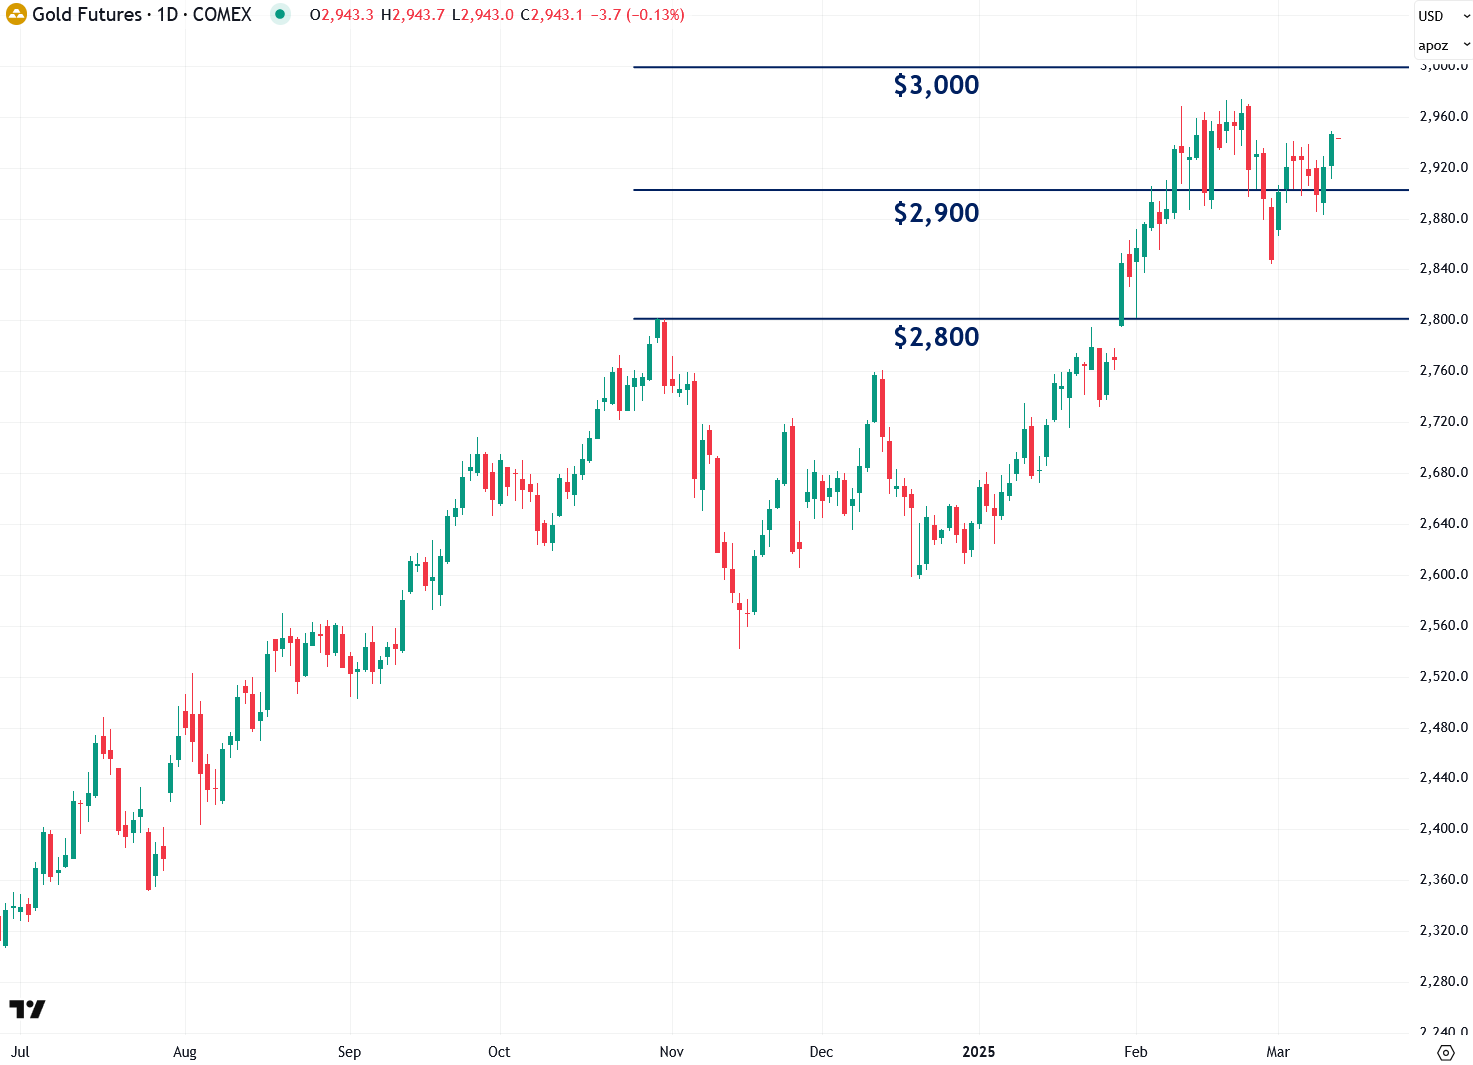
Gold has shown impressive resilience in recent weeks, holding steady even as the broader markets plunged—a clear sign of strength. Over the past year, its powerful nearly $1,000 per ounce uptrend has been punctuated by healthy consolidations, and this recent pause appears to be another of those necessary breathers.
I closely track $100 increments in COMEX gold futures, as they often serve as key support and resistance levels. Despite a few attempts to dip below $2,900, gold has held firm, and today’s rise suggests it may finally be ready to challenge the critical $3,000 resistance—a level of immense psychological significance. A decisive, high-volume close above this threshold should pave the way for even greater gains, potentially pushing gold toward $3,380 in this rally, assuming it follows its trajectory of the past three economic cycles, as I explained in December.
In addition to analyzing gold in U.S. dollars, I also track its performance against a basket of euros, British pounds, and Swiss francs. This approach removes the influence of dollar fluctuations, often providing a clearer picture of gold’s true strength. As shown in the chart, gold priced in this currency mix broke out in early January, and that breakout remains intact despite the recent pullback. To my eye, this is a healthy, orderly uptrend with plenty of room to run before showing any signs of overheating.

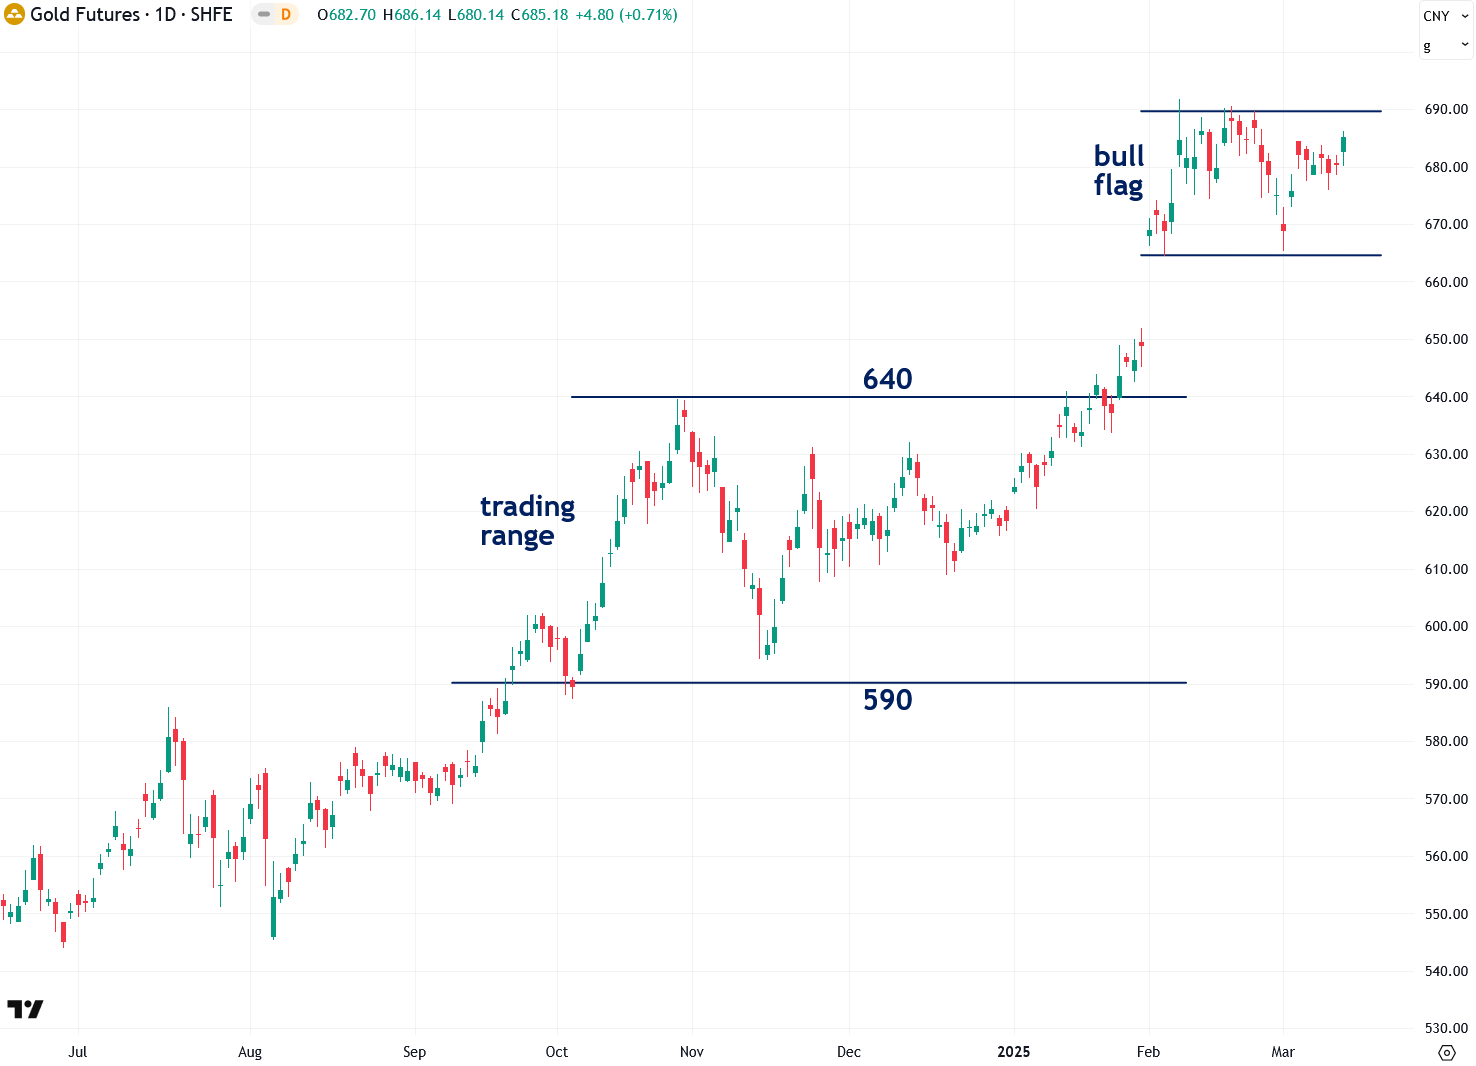
I also find it valuable to track Shanghai Futures Exchange (SHFE) gold futures, as China’s influence on the gold market continues to grow. In fact, China was a key driver behind last year’s explosive rally in March and April. In late January, SHFE gold futures broke out of a trading range between 590 and 640, igniting another leg of the uptrend.
Over the past month and a half, prices have moved sideways, but this may actually be a bullish development—it appears to be forming a bull flag pattern, which often precedes another strong move higher upon a confirmed breakout. I recently wrote about why Chinese futures traders could once again play a pivotal role in triggering another surge, much like last year.
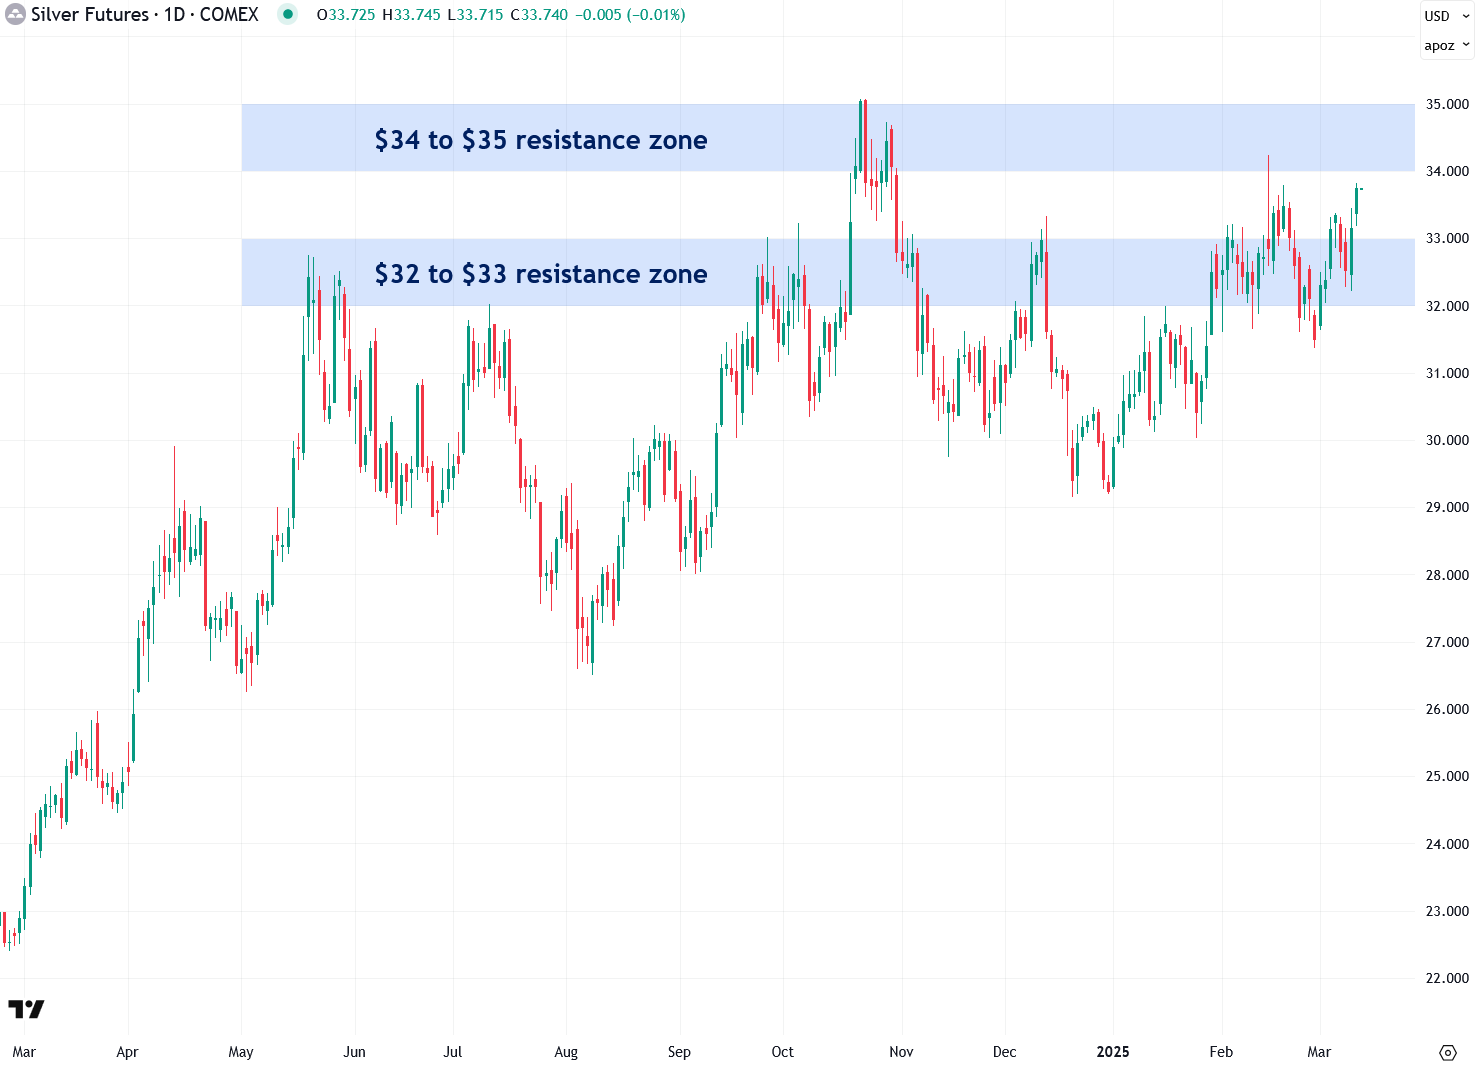
Now, let’s turn to silver, which had an impressive day, finally closing above the critical $32 to $33 resistance zone—a level it had struggled to break all year. About a week ago, I released a comprehensive video detailing this key resistance and how bullion banks like JP Morgan and UBS were deliberately keeping silver below it to suppress its price. I explained that once silver clears this barrier, it’s likely to surge.
Fortunately, we may now be witnessing the early stages of that breakout. However, for stronger confirmation, I want to see a decisive close above the $34 to $35 resistance zone that formed at the late October high. Once that happens, I believe silver will have nothing holding it back, setting the stage for a move into the $40 to $50+ range. Learn more about the bullish long-term case for silver in a detailed report I published last week.
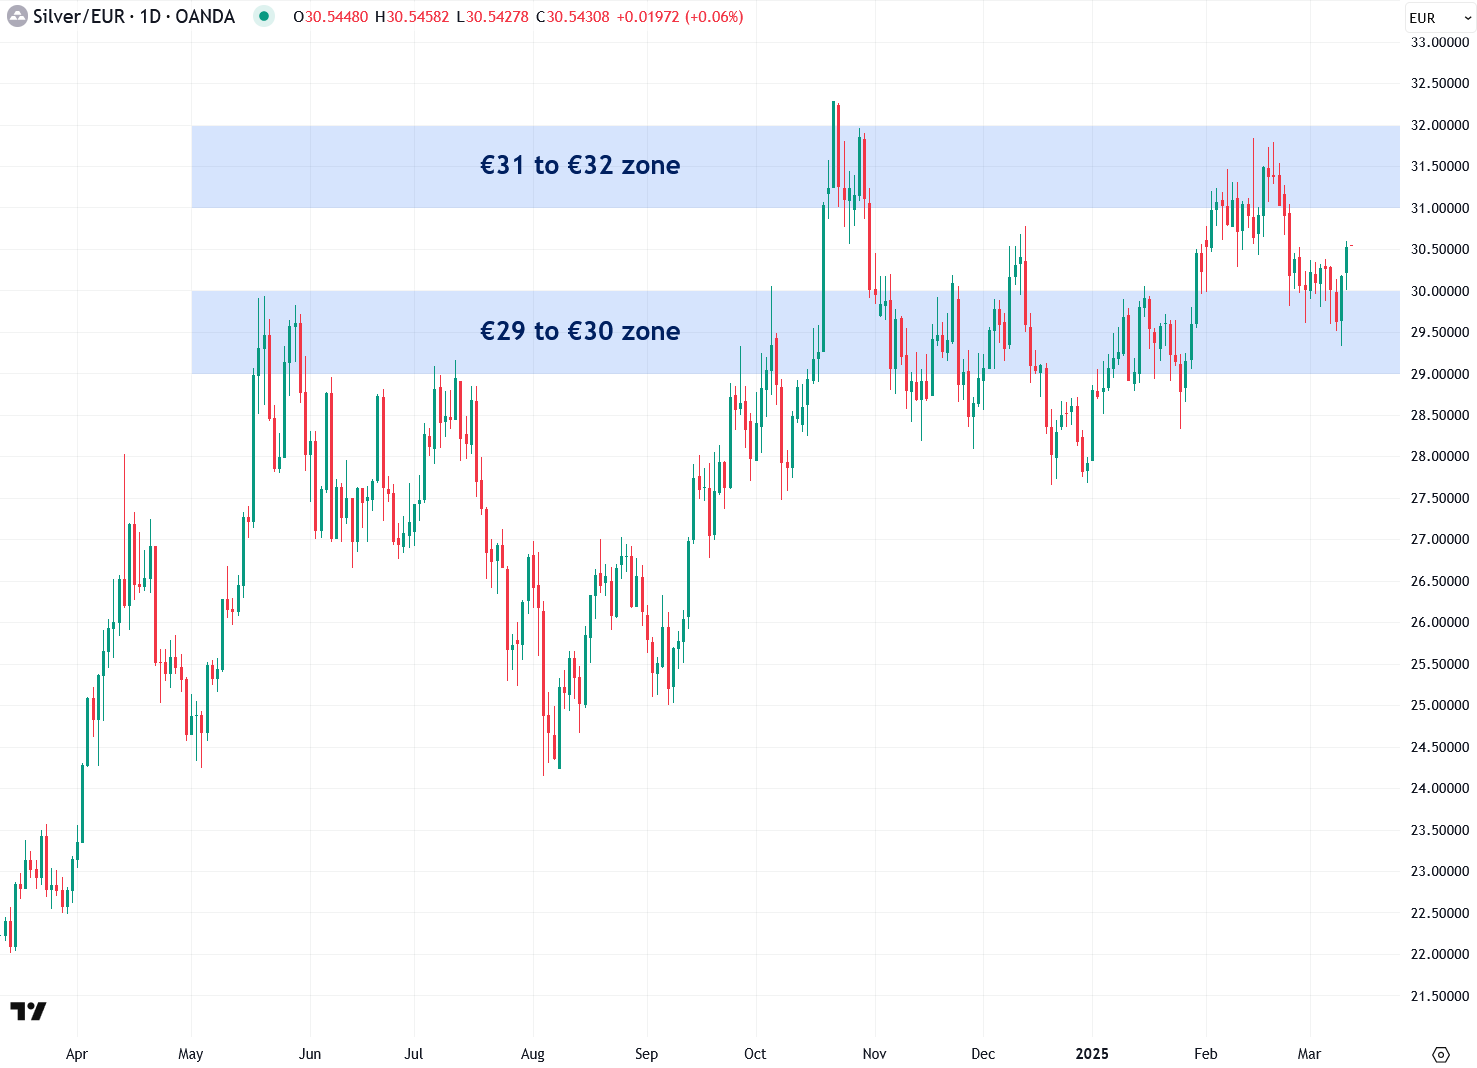
I also watch silver priced in euros because it provides valuable insights by stripping away the influence of U.S. dollar fluctuations, offering a clearer view of silver’s intrinsic strength. In euro terms, silver tends to respect key levels such as €30, €31, and €32, forming well-defined areas of support and resistance. Recently, silver broke above the €30 level—a bullish signal—establishing it as a new support. Next, a decisive close above €32 (the late October high) is necessary to signal that the next phase of the bull market has begun.
While most people instinctively recognize gold's influence on silver prices, fewer realize the significant role copper plays in influencing silver’s movement, as I explained here. This understanding led me to develop the Synthetic Silver Price Index (SSPI)—an indicator designed to validate silver’s price movements and filter out potential fakeouts. The SSPI is calculated as the average price of gold and copper, with copper adjusted by a factor of 540 to ensure gold doesn’t disproportionately impact the index. Remarkably, despite silver not being an input, the SSPI closely mirrors silver’s price movements.
For several months, I’ve been closely watching the SSPI as it struggled to break above the critical 2,600 to 2,640 resistance zone, repeatedly emphasizing that a breakout above this level would be a strong bullish confirmation for silver. Thanks to recent impressive rallies in both copper and gold, that long-anticipated breakout has finally occurred, signaling that a significant move in silver is likely imminent.

The Synthetic Silver Price Index is gaining strong momentum, fueled by rallies in both gold and copper, which are in solid technical positions. Copper recently broke out of a triangle pattern, sparking a strong uptrend. The next key test is the $5 to $5.20 resistance zone—if copper can achieve a decisive close above this level, it should trigger an even stronger phase of its bull market. Given their correlation, this breakout would likely propel silver to impressive new highs as well.

One of the key reasons precious metals have remained strong recently is the sharp decline in the U.S. Dollar Index, unfolding exactly as I predicted on January 21st. Since the Dollar Index and precious metals move inversely, weakness in the dollar typically fuels bullish momentum in gold and silver, and vice versa. The dollar’s surge leading up to and following the U.S. presidential election triggered a steep drop in gold and silver, leading many to believe the rally was over—but as I pointed out at the time, that wasn’t the case.

Interestingly, one of the primary drivers behind last fall’s surge in the U.S. Dollar Index—coinciding with Donald Trump’s increasing odds of winning the presidential election—was a massive influx of global capital into the U.S. stock market. Much of this capital flowed into the so-called "Magnificent Seven" stocks: Alphabet, Amazon, Apple, Meta, Microsoft, NVIDIA, and Tesla.
The chart below compares the U.S. Dollar Index with the Magnificent Seven ETF (ticker: MAGS), highlighting their strong correlation during both the fall rally and the recent sharp decline. This pullback in the Magnificent Seven—stocks that I believe are caught in a speculative bubble—has contributed to the dollar’s weakness, which, in turn, has provided a tailwind for precious metals.

There’s even more good news for precious metals and mining stock investors. As Crescat Capital’s macro strategist Tavi Costa recently highlighted, the U.S. Dollar Index is currently at one of its most overvalued levels relative to other fiat currencies in over 120 years of data. Similar extremes in 1933 and 1985 were short-lived and followed by significant devaluations. Given this historical precedent, there’s a strong probability of further dollar weakness ahead—an outcome that would be highly favorable for precious metals and mining stocks.

Another factor weighing on the dollar and stocks—while providing a tailwind for gold and silver—is the growing risk of a recession. I first warned about this in December and recently provided a more in-depth analysis on the subject.

A noteworthy development in the past few days is the sharp breakdown of the bellwether S&P 500 index relative to gold. As shown in the chart below, the S&P 500-to-gold ratio has fallen below the key 2.00 support level this week and is now on the verge of breaking below a long-term uptrend line dating back to 2011. This signals a major capital rotation from stocks into gold, a shift that historically precedes periods where gold significantly outperforms equities. Such transitions often mark the beginning of the most explosive phases of a precious metals bull market as well as equity bear markets. Note that the monthly S&P 500-to-gold ratio candle needs to close under both support levels for full confirmation.
This week’s breakdown in the S&P 500-to-gold ratio further reinforces the trend I’ve highlighted in recent months with the Dow-to-Gold ratio. That chart showed a major breakdown beginning a year ago, and the decline is now accelerating. This signals that the precious metals bull market is still in its early stages, rather than nearing maturity, implying significant upside potential ahead.
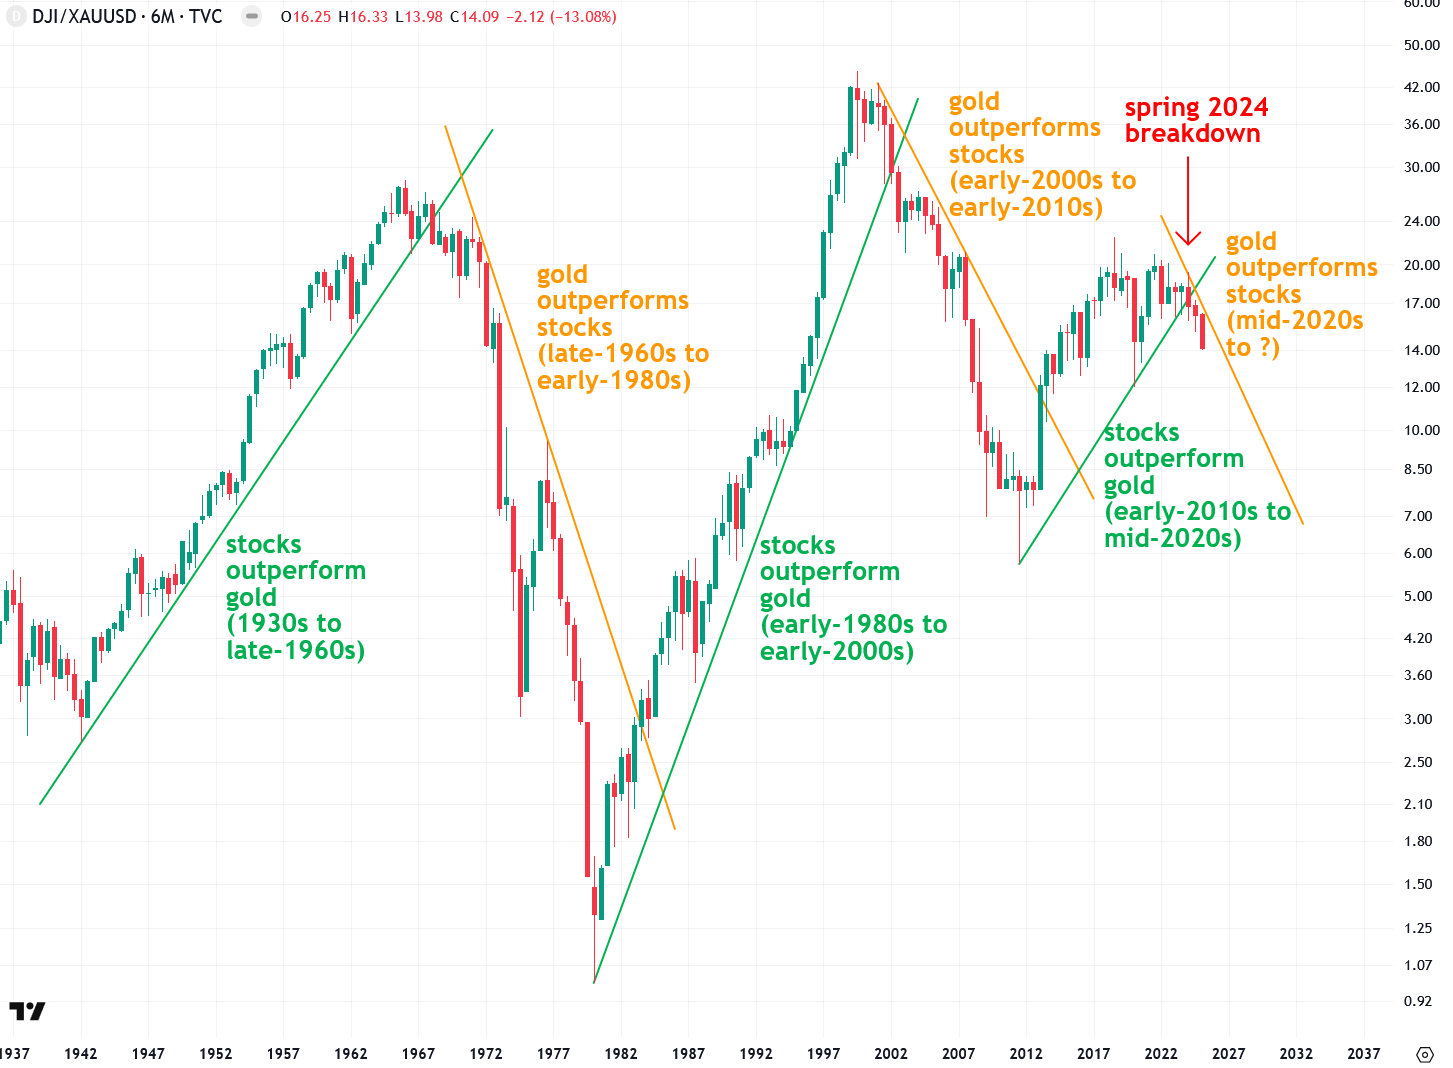
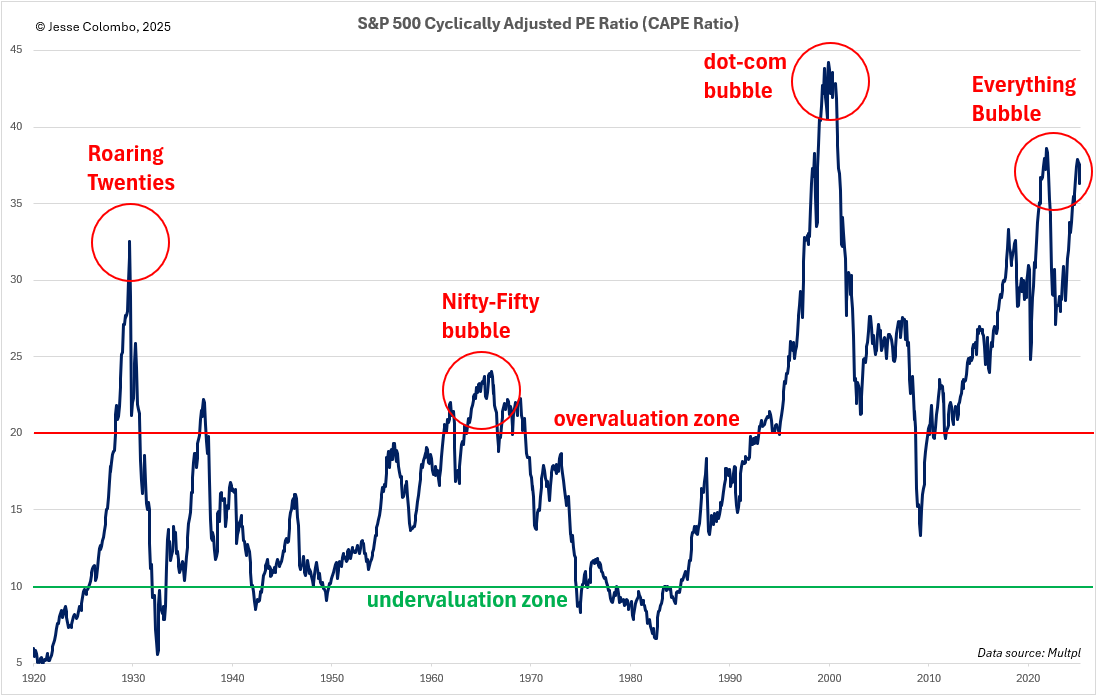
The ratios of major U.S. stock indices to gold have much further to fall, as they remain deeply entrenched in a massive bubble—one confirmed by multiple indicators, including the S&P 500’s cyclically adjusted price-to-earnings (CAPE) ratio. Learn more about this dangerous stock market bubble. As the bubble deflates and valuations revert to the mean, I see trillions of dollars flowing into precious metals and mining stocks, driving them significantly higher. I ultimately see gold reaching at least $15,000 per ounce and silver surpassing $300 as these bubbles burst, triggering a massive financial reset.
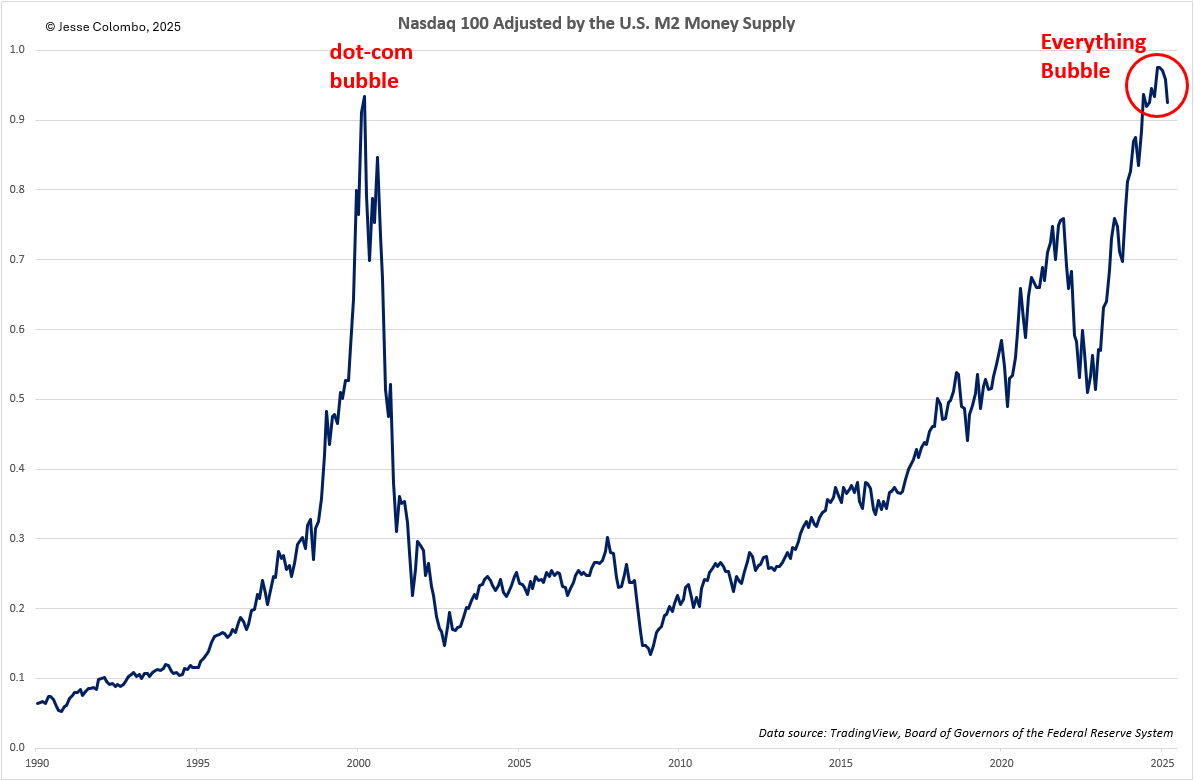
The tech-heavy Nasdaq 100 is even more inflated than the S&P 500, as evident from the chart showing the Nasdaq 100 adjusted for (or divided by) the U.S. M2 money supply. By this measure, the Nasdaq 100 has reached roughly the same extreme level of overvaluation seen during the late 1990s dot-com bubble, which ultimately ended in a brutal bear market—and the current bubble is headed for a similar fate.
In summary, gold and silver remain in strong positions, holding up well despite recent volatility in global financial markets. I have a strong sense that a major breakout is imminent, but full confirmation is needed—specifically, COMEX silver futures must close above the $34 to $35 resistance zone, and COMEX gold futures must surpass the critical $3,000 level. Once these breakouts occur, I expect the next phase of the precious metals bull market to shift into a much more dynamic and powerful stage, contrasting with the steady, orderly climb of the past year.
If you found this report valuable and haven’t subscribed yet, sign up below! →
Disclaimer: the information provided in The Bubble Bubble Report and related content is for informational and educational purposes only and should not be construed as investment, financial, or trading advice. Nothing in this publication constitutes a recommendation, solicitation, or offer to buy or sell any securities, commodities, or financial instruments.
All investments carry risk, and past performance is not indicative of future results. Readers should conduct their own research and consult with a qualified financial advisor before making any investment decisions. The author and publisher disclaim any liability for financial losses or damages incurred as a result of reliance on the information provided.
Jesse, you are about the first person that aligns with my views on Silver and Mining Stocks.
I see the GSR falling by half from current 90:1 to 45:1 - a level it has hit 10 times on a quarterly basis since 1998.
That would indeed mean an approx. US$ figure per oz IMHO, of circa $6,000 Gold and $133 Silver without any revaluation within the next 18 months. Being an Industrial Metal in more recent years than Monetary, the GSR has increased.
When retail Investment Demand adds to the Industrial (deficit imbalance) demand, the spike similar to recent moves seen in gold will happen - no mean feat bearing in mind manipulation of the small Silver market and no Tier One asset label, like it's big brother.
It is better to be early than late in these precious metal markets; the train is about to leave the station in my view - never to return. A "commodity and asset basket" is likely to back the USD ending the Fiat Fiasco since 1971.
The poor man's gold effect will spill over from Gold to Silver pushing the price northwards; the retail selling of Ag just to break even will stall imminently and switch to FOMO mode. Eventually, when you hear about it on News at 10pm, you will be ready to sell at the top. I think 90% of the move in Silver comes in the last 10% of the time.
Lowercosta.com
We might be watching a capital rotation event unfolding in real time (no jinx).