Why Copper Is Set to Supercharge Silver's Bull Market
Copper is like a rocket on the launch pad, and when it takes off, it will drive silver much higher as well due to their close relationship.

Anyone who has been a subscriber for more than a couple of months knows that, in addition to precious metals, I am also a copper bull, and I periodically check in on it to see how it is doing. I am very interested in the bullish thesis for copper on its own as an investor (learn more), and it also has the added benefit of giving useful signals for silver (learn more).
A bull market in copper, which I expect, should also supercharge silver’s bull market, which is a win-win in my book. Thankfully, copper has been on a tear lately, so I wanted to give an update on the situation and reiterate why I believe it is about to seriously amplify silver’s bull market as well.
So let’s take a look at what’s happening in the chart of Grade A copper futures traded on the London Metal Exchange (LME). I prefer following that contract instead of the more popular High Grade Copper futures traded on the U.S. COMEX exchange, ever since the Trump administration’s bungled tariff announcements this spring caused severe price distortions and made COMEX futures copper virtually useless for technical analysis, as I explained in a previous update. Like COMEX copper, LME copper futures are priced in U.S. dollars, but quoted per metric tonne rather than per pound.
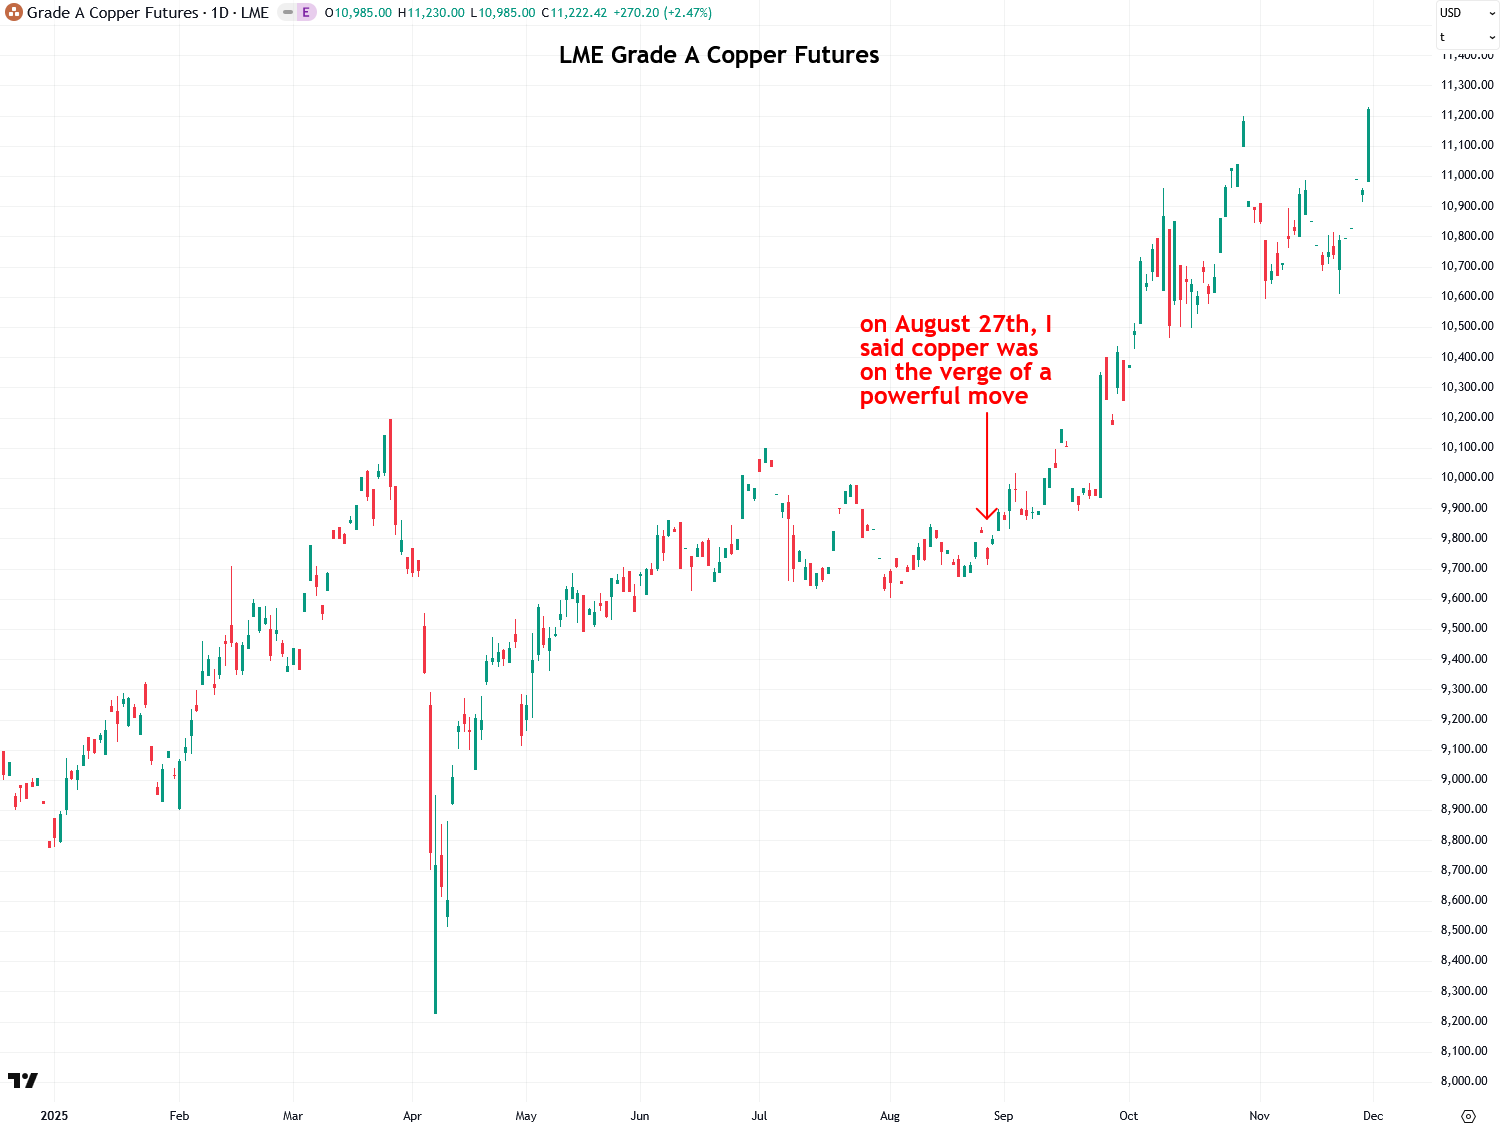
Back on August 27th, I published a report highlighting a volatility squeeze in copper, which I anticipated would lead to a significant move in both copper and silver. Over the past three months, that scenario has played out perfectly, with copper surging to a new all-time high of $11,222 per tonne on Friday. In my view, this move is only just beginning. There are several factors driving copper’s recent breakout, and I’ll dive into those later in the report, after covering the technical analysis portion.
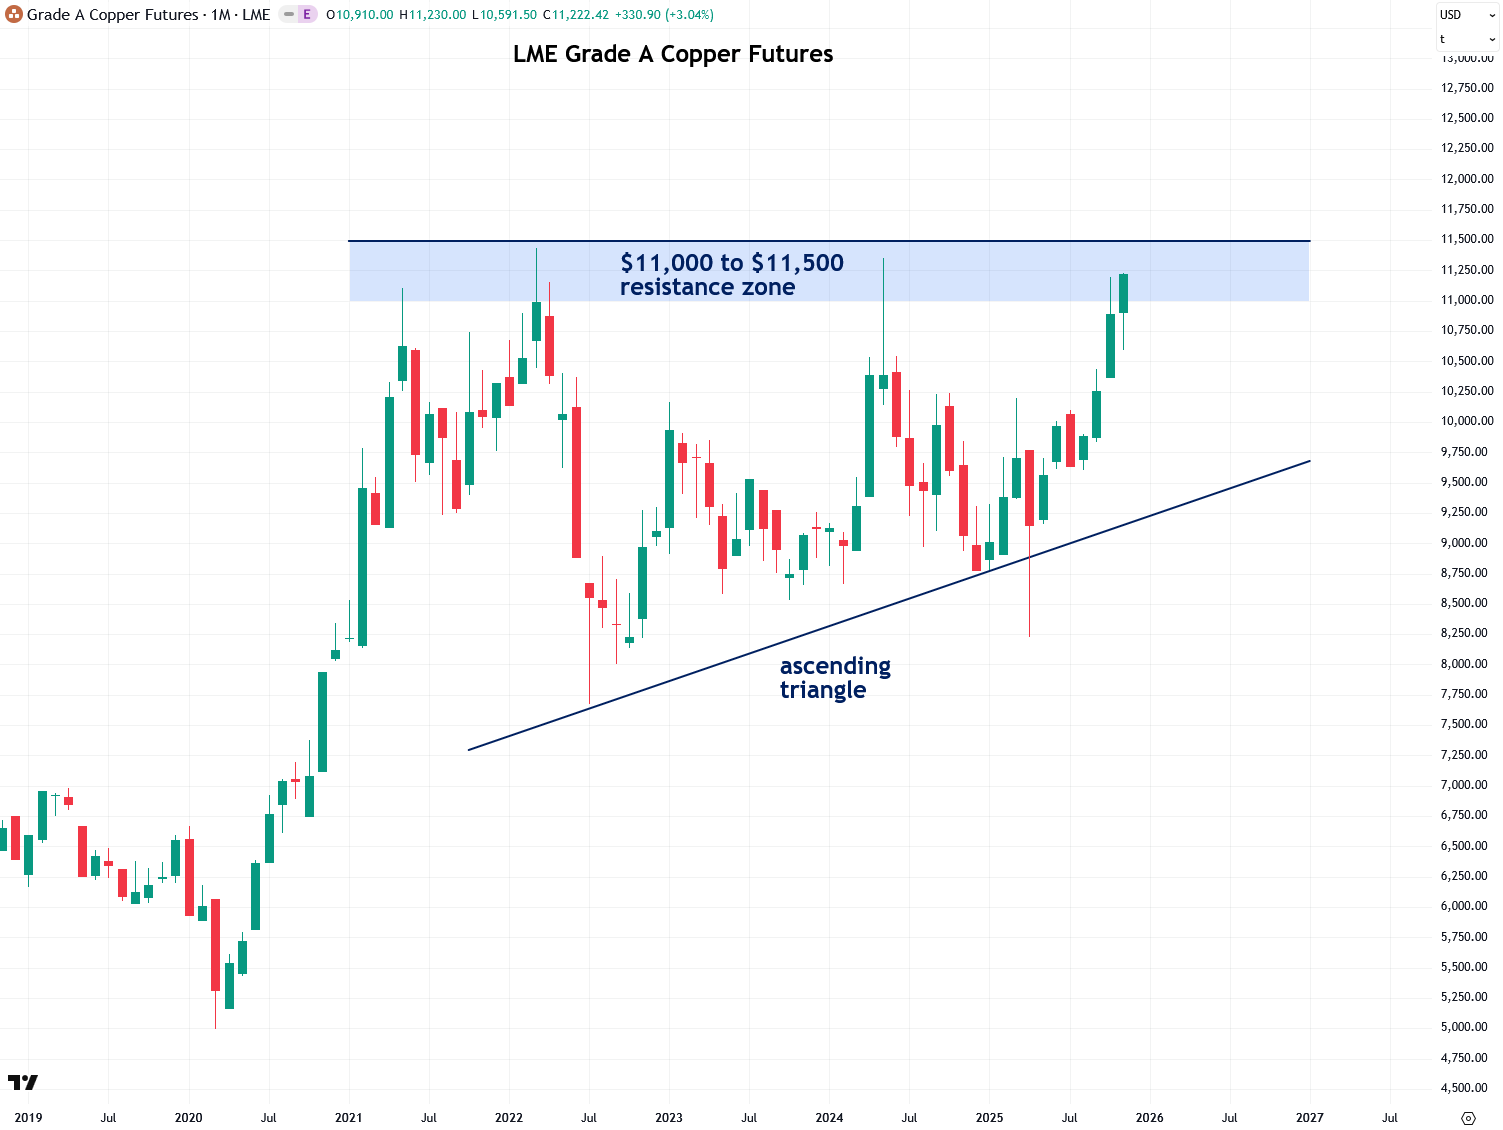
Looking at the longer-term monthly chart of copper, we can see it has been forming an ascending triangle pattern since 2021 and is now on the verge of breaking out. The key level I’m watching to confirm this breakout is the $11,000 to $11,500 resistance zone. A strong, high-volume close above that zone would be the signal that the fireworks are about to begin.
To learn more about support and resistance zones, I recommend reading my two-part tutorial on the topic (Part 1 and Part 2).