


Assessing the Stock Market After the Latest Trade Developments
Naive investors are once again getting swept up in stock market euphoria, blindly ignoring the fact that none of the underlying problems have been solved.

The stock market staged a major roundtrip over the past month and a half after President Trump launched a barrage of aggressive new tariffs—only to reverse course once the market reacted poorly. The selloff deepened to the point where even U.S. Treasuries began falling, signaling that the turmoil extended far beyond equities. Markets rallied again after the U.S. and China agreed to a 90-day tariff truce this weekend.
As I’ve been explaining, retail investors (aka the “dumb money”) have been the driving force behind the rebound, pushing valuations back toward their prior bubble highs—one of several reasons I remain skeptical of this rally and far from enthusiastic about it. In this article, we’ll examine how the major U.S. stock indices stand after the latest trade developments.
Let’s start by examining the bellwether S&P 500. The index has pushed back into the key 5,800 to 6,600 resistance zone—an area that marked the breakdown back in early March. This move represents an attempt to reverse that decline, but for this rebound to be considered truly convincing, I’d want to see a decisive breakout not just above the resistance zone, but also above the critical 6,200 level, which corresponds with the S&P’s all-time highs from December through February.
A strong push above 6,200 on heavy volume would signal that the recent downturn is over and that the market is ready to resume its climb. However, the lackluster volume during the rebound over the past month is a notable red flag, suggesting there’s limited conviction or real buying power behind the rally.

A look at the S&P 500’s longer-term weekly chart reveals that the recent rebound began right off the 4,600 to 5,000 support zone and the five-year-old uptrend line. While I’m known as a “big, bad bear,” in fairness, I did highlight this support zone and noted on April 8th—near the very bottom—that there was a strong likelihood of a bounce from that area. So far, that’s exactly what has unfolded.
The index is now sandwiched between that key support and the 5,800 to 6,000 resistance zone overhead. How the S&P 500 behaves at either of these two levels will determine its next major move. A decisive break below the 4,600 to 5,000 support zone and long-term trendline would be a clear signal that a deeper bear market is underway. On the other hand, if the index somehow manages to close decisively above the 5,800 to 6,000 resistance zone—which I see as less likely—it would negate the recent technical breakdown.
I take a reactive rather than predictive approach to the markets. Instead of trying to predict what’s going to happen, I wait for the market to reveal its intentions. If it breaks below key support levels, I turn bearish; if it breaks above major resistance, I turn bullish.
That’s really all anyone can do—because no one has a crystal ball, and much of the market’s direction is being driven by political decisions lately. Even the politicians themselves often don’t know what they’ll do next week late alone next month. That’s why it’s critical to remain flexible, responsive, and grounded in the reality that many variables are simply beyond our control.

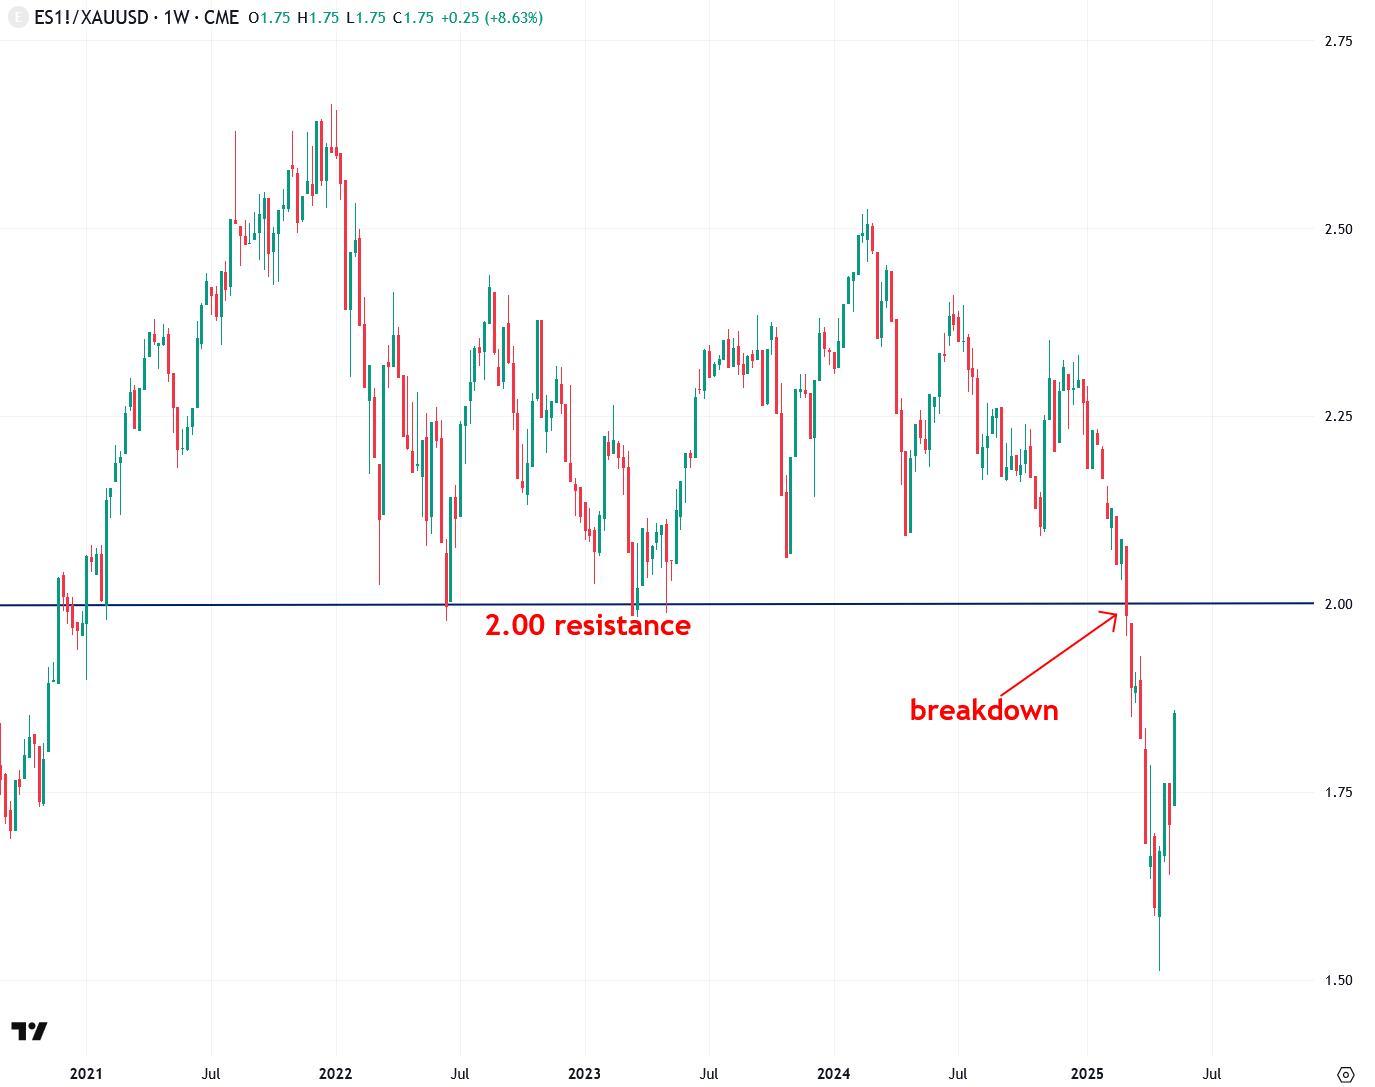
Next, I want to highlight the S&P 500 to gold ratio, which measures the performance of the stock market relative to gold by dividing the S&P 500 by the price of gold. Earlier this year, the ratio broke below the key 2.00 level—a move I pointed to as evidence of a major capital rotation out of overvalued stocks and into gold, a trend I believe is still underway.
However, the recent stock market rebound and gold’s consolidation have caused the ratio to bounce. For now, that’s all it appears to be—a bounce. The 2.00 level now looms as a critical resistance zone, and it’s one to watch closely.
Next, let’s take a look at the tech-heavy Nasdaq 100, which has dominated and driven the broader U.S. stock market in recent years. In recent weeks, the Nasdaq 100 rebounded off the 17,200 to 17,600 support zone that I highlighted on April 8th, and has since broken through its former resistance between 20,750 and 21,000—a sign of short-term bullish momentum. However, the light trading volume behind the move raises some red flags about the strength and sustainability of the rally.
For the Nasdaq 100 to signal that its correction is truly over, it would need to close convincingly above the 22,000 to 22,500 resistance zone—an area that marked the market’s peak from December through February. However, given how overvalued the Nasdaq 100 and the broader market still are, I see that outcome as unlikely, as I’ll explain shortly.

The Nasdaq 100’s weekly chart shows that this week it reversed the breakdown of the uptrend line that began in January 2023—a short-term positive for the bulls. However, as mentioned earlier, the index would still need to close decisively above the 22,000 to 22,500 resistance zone to confirm that the correction is truly over.

The Nasdaq 100—and the broader market—has been largely powered by the “Magnificent 7” stocks in recent years: Alphabet, Amazon, Apple, Meta, Microsoft, NVIDIA, and Tesla. A key proxy for their performance is the MAGS ETF, which tracks this elite group.
The MAGS ETF recently closed above the $50 resistance level, which is a constructive sign of momentum. However, the next key test is a close above $53. More importantly, to fully negate the recent correction, it would need to break and hold above the $57 to $59 resistance zone that marked the peak from December through February.
Nvidia—one of the most influential stocks in the world thanks to its leadership in the AI boom and its place in the “Magnificent 7”—has rebounded sharply in recent weeks. However, it’s currently hovering just below the key $135 to $155 resistance zone, and a decisive close above that zone is needed to fully negate its recent correction.

Apple—a key bellwether of the “Magnificent 7” and one of the most heavily weighted stocks in both the Nasdaq 100 and S&P 500—has also regained a notable portion of its recent losses. However, it still needs to close convincingly above the $200 to $220 resistance zone to further signal that its correction is over.
The Dow Jones Industrial Average (DJIA) flashed a bearish signal in early April when it closed below the key 41,500 to 42,000 support zone. Since then, it has rebounded back above that level, but on light volume—raising some doubts about the strength of the move. To fully signal that the correction is over, the DJIA would also need to close decisively above the 44,500 to 45,500 resistance zone, which marked the highs from December through February.

The small-cap Russell 2000 has managed to close back above the 2,000 to 2,025 resistance zone, which is an encouraging step. However, it still faces several major resistance levels ahead—including the 2,175 to 2,200 zone and the 2,300 to 2,325 zone. A decisive close above those levels would be needed to provide stronger confirmation that the correction is truly over.
I’ve been closely monitoring homebuilding stocks, as represented by the XHB ETF, because they serve as a key economic bellwether. Housing often leads the broader economy both into and out of recessions, making it a critical indicator to watch.
I’m particularly concerned that the next recession will be driven not only by a tech bust but also by housing when Housing Bubble 2.0 bursts.
U.S. housing has become extraordinarily unaffordable and unsustainable—clear evidence of a bubble. The median-priced home now sits at $433,100, requiring an annual income of $166,600 to afford, while the median household income is just $78,538. (Read my full thoughts on the housing bubble and bust scenario here.)
From a technical standpoint, the XHB ETF has moved back into its $96 to $100 resistance zone, but it would need to close decisively above that zone to signal that the correction is on pause.

The Volatility Index, or VIX—a widely followed gauge of market fear—has plunged in recent weeks and is now back at levels indicating that investor complacency has returned. As I recently pointed out, this sharp rebound in sentiment is highly unusual following such a steep correction. It signals that optimism—especially among amateur investors—has recovered too quickly and gone too far, which rarely ends well.
Sure enough, CNN’s widely followed Fear & Greed Index—a popular gauge of investor sentiment—now indicates that greed is the dominant emotion in the market. That’s a clear warning sign that this rebound has likely run too far, too fast.

The market rebound over the past month has also extended to cryptocurrencies like Bitcoin—something that typically happens when animal spirits return. As I’ve written before, Bitcoin behaves more like a high-risk, speculative asset—similar to hot, high-flying tech stocks—than a true safe haven like gold. That’s why it tends to rally during optimistic periods and decline when markets turn risk-off.
Bitcoin is currently trading near its all-time highs from December and January. To signal that it’s ready to enter another phase of its bull market, it would need to close decisively above the $100,000 to $110,000 resistance zone. However, if it fails to break through that level, another correction is likely.

Although the stock market has rebounded and investor enthusiasm is returning, I find it hard to share in the excitement—because valuations are now right back near the extreme highs we saw earlier this year. By virtually every major valuation metric, the market remains extremely elevated and at levels only seen during historic bubbles that ended horribly.
Valuations are one of the most reliable predictors of future market performance, and when they reach the stratosphere—as they have once again—it means future returns will be severely limited, even in a best-case scenario where the economy stays strong and corporate earnings continue to grow.
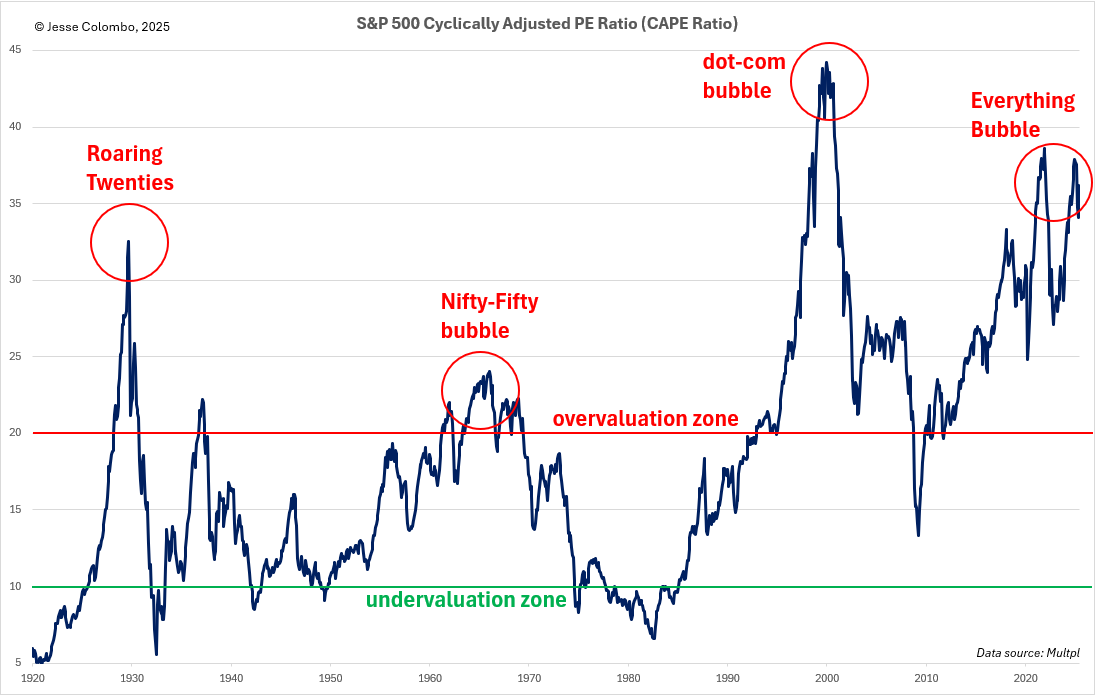
One of the most reliable valuation metrics, the cyclically adjusted price-to-earnings ratio (CAPE) shows that in recent years, the U.S. stock market became even more overvalued than it was in the late 1920s—right before the 1929 crash and the Great Depression.
As far as I’m concerned, this level of overvaluation can only end in disaster. That’s why I’m positioning and investing accordingly. I have zero interest in touching the mainstream stock market until the CAPE falls below 10—just like it did in the early 1980s—because that’s the only reliable signal that a true generational bottom has been reached. Until then, I’m taking refuge in precious metals and their mining stocks—because in times like these, they’re the only assets I can trust.
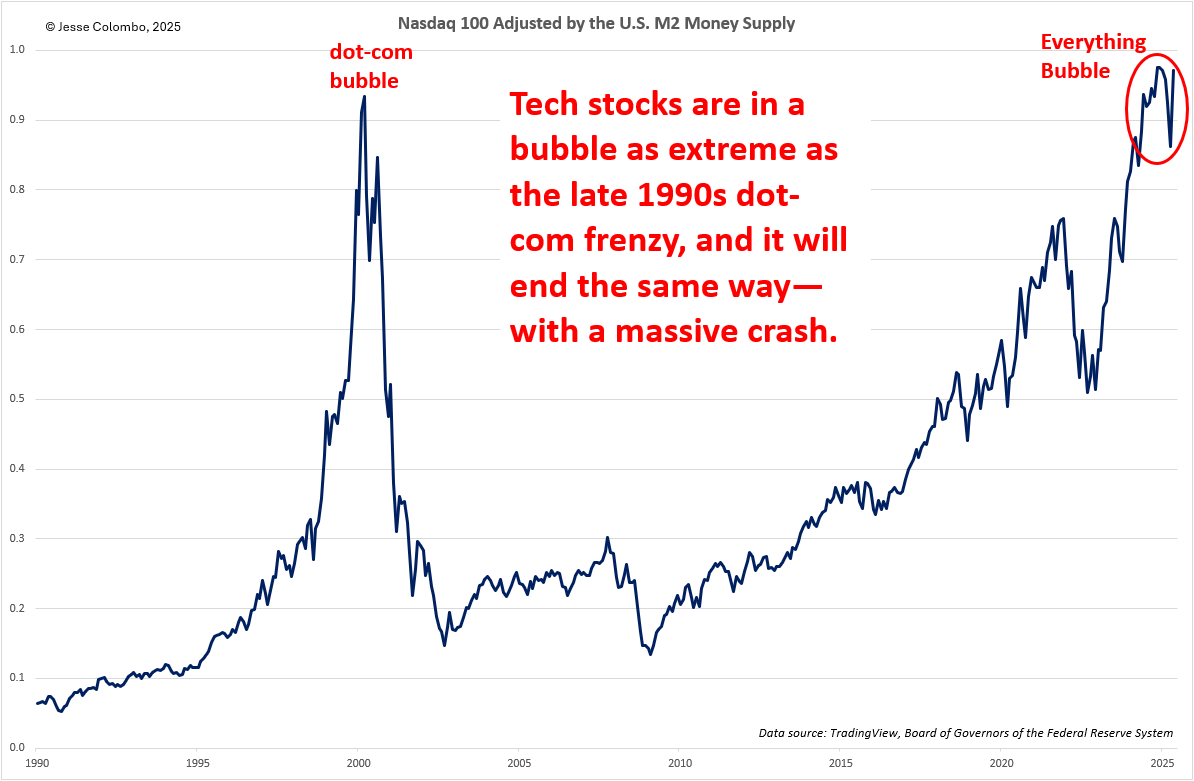
There’s no shortage of valuation metrics flashing red, all pointing to the same conclusion: the stock market is dangerously overvalued. One more I’ll show you is the Nasdaq 100 divided by the U.S. M2 money supply—a useful way to gauge whether an asset has run too far ahead of monetary fundamentals. Sure enough, the Nasdaq 100 has done exactly that. Its recent rebound only pushes it further into overvalued territory, making the eventual come-down even steeper. Sigh…
There’s been a lot of fanfare in recent weeks from bullish investors and politicians claiming that U.S. recession risk is fading—thanks largely to Trump backing down from his previously aggressive tariff stance. But in my view, that’s a short-sighted and frankly naïve take. Tariffs were never the biggest threat to the economy. The real risk has always been the eventual bursting of today’s massively inflated bubbles—particularly in tech and housing—as I warned back in December, January, and again in March.
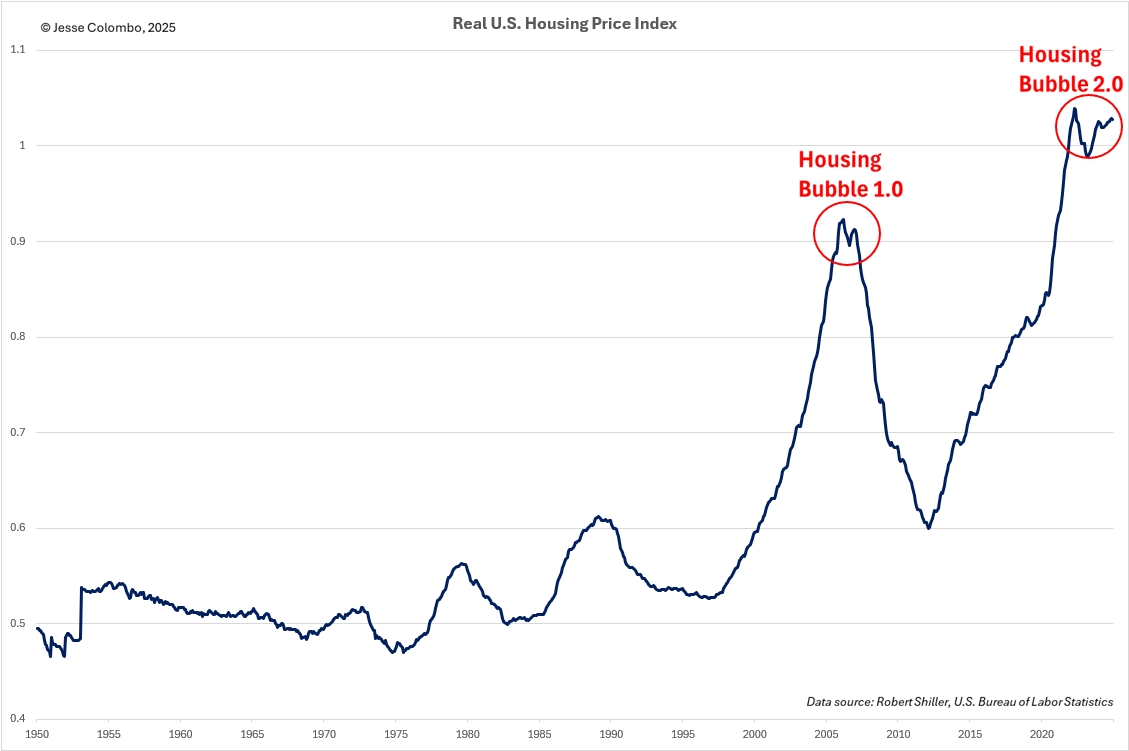
Speaking of the housing bubble, it’s clear that U.S. home prices have once again far outpaced the underlying fundamentals—whether measured against the Consumer Price Index, household incomes, or rents. This kind of disconnect is exactly what we saw in the mid-2000s, and we all know how that ended: with the Great Recession. Unfortunately, history is rhyming, and this latest housing bubble is on track to end the same way.

The current U.S. housing bubble is evident from multiple angles, including inflation-adjusted home prices—which have now surpassed the peak of the mid-2000s housing bubble. That alone is a clear sign of how extreme and unsustainable this housing market has become.
Anyway, to sum it up—investors are getting whipped into a frenzy over Trump backing down from his more extreme tariff policies and the temporary pauses in the trade spat with countries like China. But I’m not buying the hype. Even if the entire tariff saga were resolved overnight, we’d still be facing far more serious problems: crushing debt loads, deepening societal dysfunction, and asset bubbles nearly everywhere you look.
That’s why, regardless of how high the market bounces or how euphoric sentiment gets, I’m not jumping on board. Fortunately, I’m firmly positioned in precious metals, which offer a far better risk-reward profile for the years ahead. That gives me peace of mind—because no matter what happens in the short term, I know I’m on a much more solid path.
If you’ve enjoyed this report or have any questions, comments, or thoughts, please give this post a like and share your thoughts in the comments below—I’d love to start a dialogue and hear your perspective.
Disclaimer: the information provided in The Bubble Bubble Report and related content is for informational and educational purposes only and should not be construed as investment, financial, or trading advice. Nothing in this publication constitutes a recommendation, solicitation, or offer to buy or sell any securities, commodities, or financial instruments.
All investments carry risk, and past performance is not indicative of future results. Readers should conduct their own research and consult with a qualified financial advisor before making any investment decisions. The author and publisher disclaim any liability for financial losses or damages incurred as a result of reliance on the information provided.
Another outstanding comprehensive analysis from Jesse. Read it to its compelling conclusion!
another monster highly detailed and heavy-with-facts newsletter. not just the overall stock
markets, but the Everything Bubble.
yes, silver and gold got hit hard. gold under $3,152, silver under $32, and HUI at 358. no one
ever said life was easy. silver is even more so the most undervalued asset on earth, and gold
second. this is just another buying opportunity, not something to get upset about. again,
buffett got rich by buying value and holding for the long term. he was NEVER a trader, but
rather a buy and hold kinda guy. be right and sit tight.
the Everything Bubble is bursting as you are reading this. it is the period of CHAOS right
now, and it will continue until the period of war. silver and gold are your ONLY economic
saviors. nothing else. nothing even close.