
Proof That Pullbacks Occur in Every Epic Bull Market
A tour through some of the most stellar investments in history, including stocks, commodities, and crypto, to show that pullbacks and corrections are simply an inevitable part of the journey.

In this newsletter, in addition to providing the usual precious metals market analysis and educational content, I place a strong emphasis on encouragement and psychological support for my subscribers. We are in this precious metals investing journey together, and in my experience, the psychological element is actually one of the biggest challenges most investors face. It may even be more difficult than the analytical or intellectual side.
When precious metals are moving higher, confidence runs high and investors don’t need much reassurance. But when the inevitable pullback comes, the mood shifts quickly, and my inbox fills with anxious messages. That’s why I write pieces like my recent article, “The Precious Metals Pullback Is No Reason to Panic,” to help put things into perspective and remind everyone to stay focused on the extremely bright long-term outlook for precious metals.
I often point out that every major investment success in history—from Nvidia to Berkshire Hathaway—has included regular pullbacks and even full-blown corrections. So in today’s piece, I want to take you through some of the biggest investment winners of all time and show how they achieved mind-boggling long-term gains, but only for those investors who were able to endure the many pullbacks along the way. I offer this as encouragement in light of the recent pullback in precious metals and mining stocks.
I also want to highlight that all of these charts use logarithmic scales instead of the more traditional arithmetic scales. This approach is particularly useful when analyzing data series like asset prices that have experienced significant growth over time. A logarithmic scale displays equal percentage changes as equal visual distances, rather than equal absolute increments. This allows for a more meaningful comparison of growth and declines across different price levels. [Click here to learn more about logarithmic charts and their advantages.]
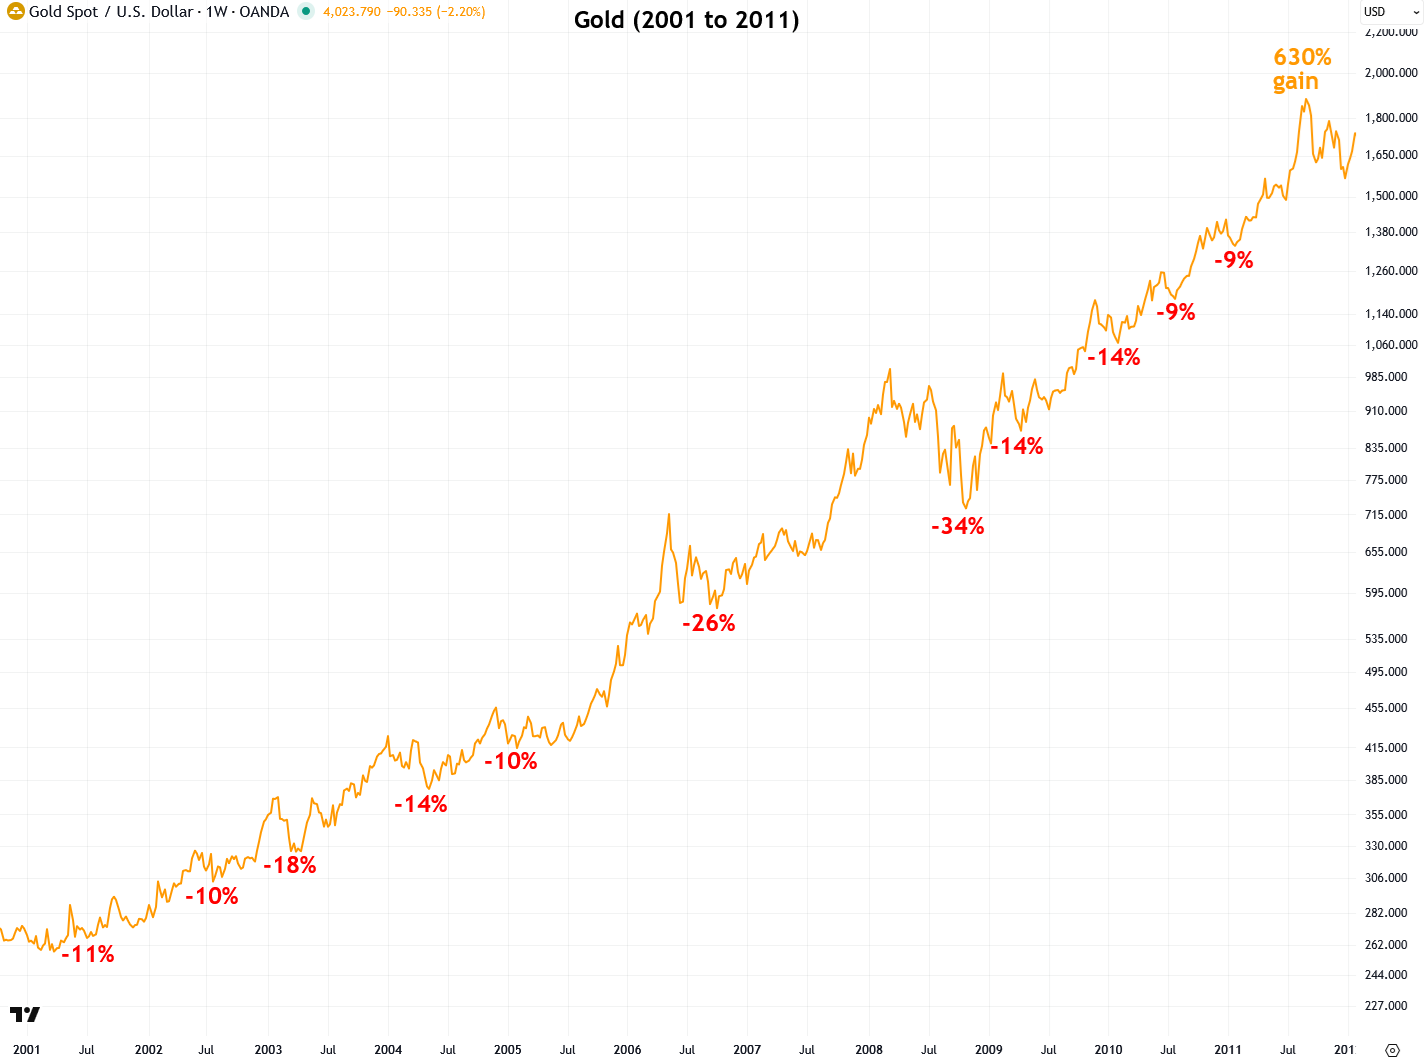
So let’s begin with gold’s last secular bull market, which lasted from 2001 to 2011 and delivered a gain of 630%. While that return is clearly impressive in hindsight, any investor who captured it had to endure eleven significant pullbacks of at least 9%. Two of those were nearly one-third declines. This should help put gold’s recent 11% pullback into perspective.
If that recent pullback made you feel anxious or uncertain, it is worth asking yourself how you would have handled the many pullbacks during the previous bull market. Would you have sold in a panic and missed out on the full 630% gain? That is an important question to consider, especially as we embark on gold’s current secular bull market.
As I explained in this report, I believe gold is on a long-term path to $15,000, $20,000, $30,000 per ounce and even higher. Staying grounded during short-term volatility is key to achieving the full potential of this unfolding move.
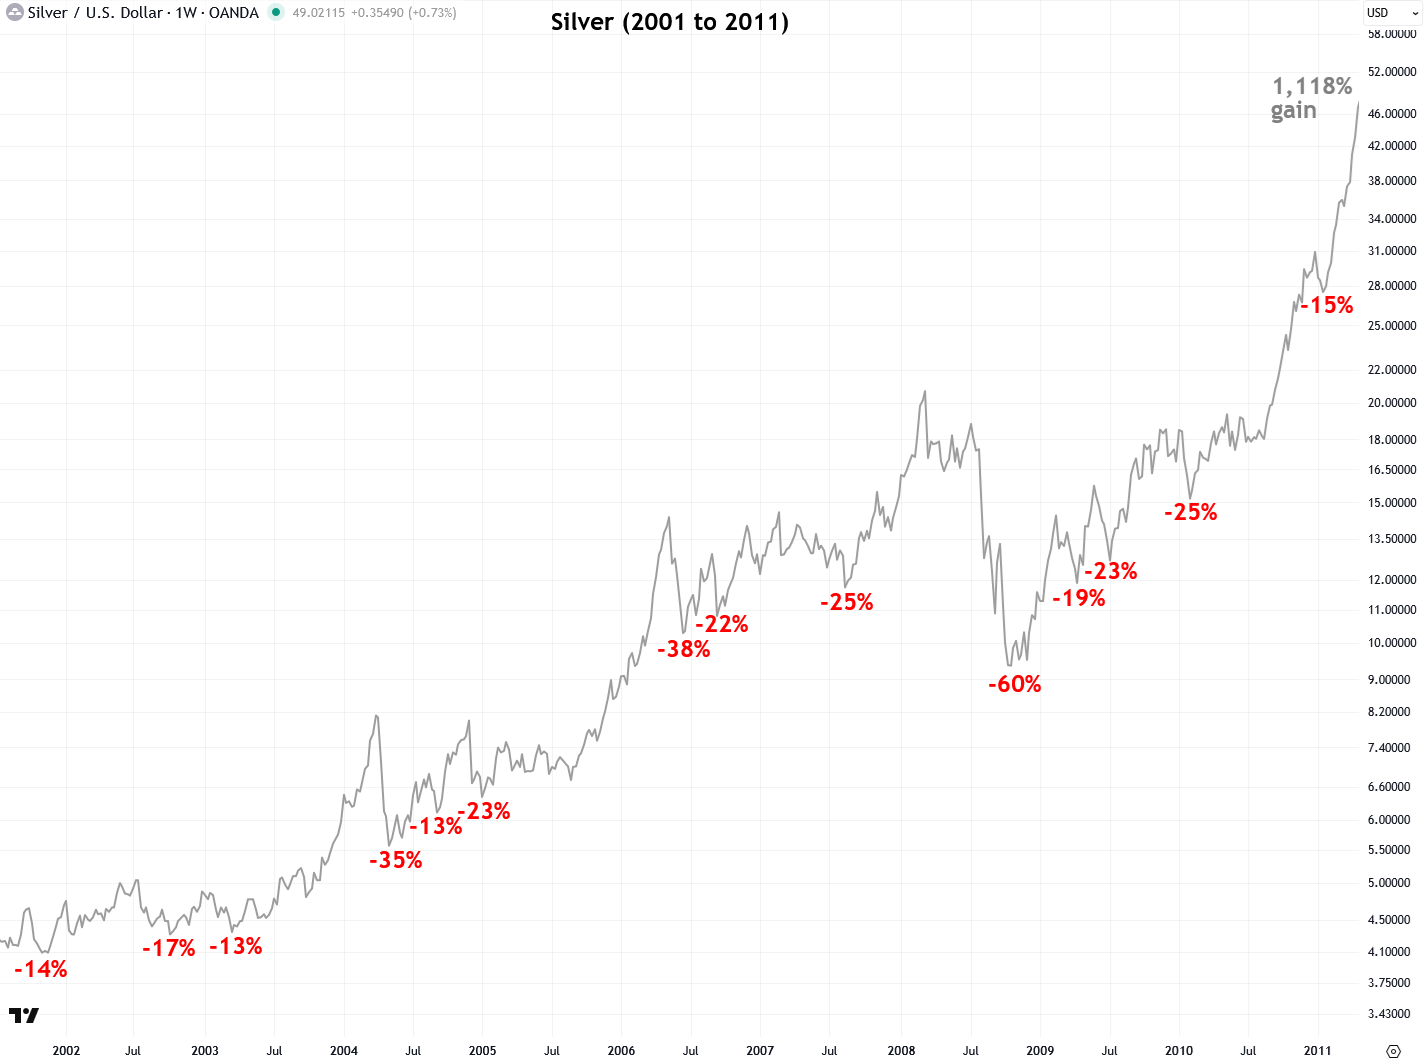
Silver, which is more volatile than gold, gained even more than gold during its own secular bull market in the 2000s, rising by 1,118%. However, that impressive gain came with plenty of challenges. Along the way, there were 14 pullbacks and major corrections of at least 10%, with some declines reaching roughly one-third and even two-thirds in magnitude. This context helps put silver’s recent 15% pullback into perspective and shows that such moves are a normal part of bull markets. It is important to stay grounded when they occur.
Like gold, I believe silver is currently in a major secular bull market that will ultimately send it to at least $500 per ounce (learn more). That outlook is a strong reason to remain patient and committed, rather than getting shaken out and missing out on what will be an extraordinary gain.
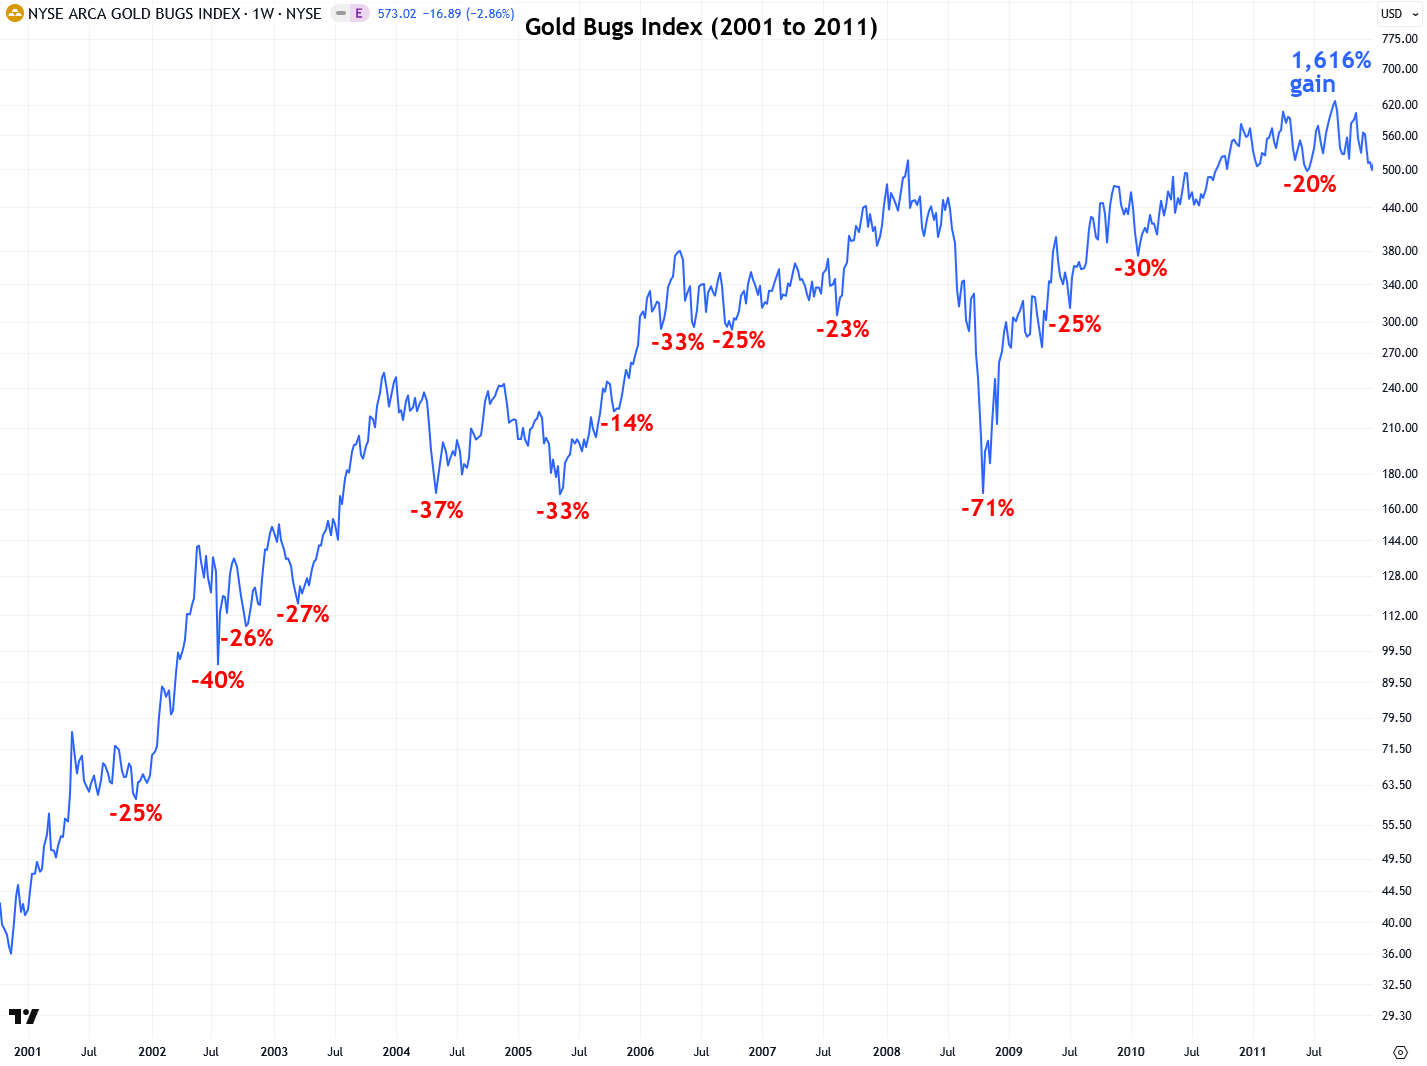
Gold and silver mining stocks are even more volatile than gold and silver themselves, but they also tend to deliver greater gains during bull markets. That is exactly what happened during the 2000s secular bull market, when the Gold Bugs Index of mining stocks surged by 1,616%. However, investors had to endure at least 14 major pullbacks and corrections of 10% or more along the way.
Yes, mining stocks have pulled back over the past two weeks, but as the chart below shows, this kind of move is completely normal during a strong bull market. I expect them to rise significantly from here, as I explained in this report. That said, this recent pullback will not be the last. Only tenacious investors will be able to endure the pullbacks and corrections that lie ahead on the path upward.
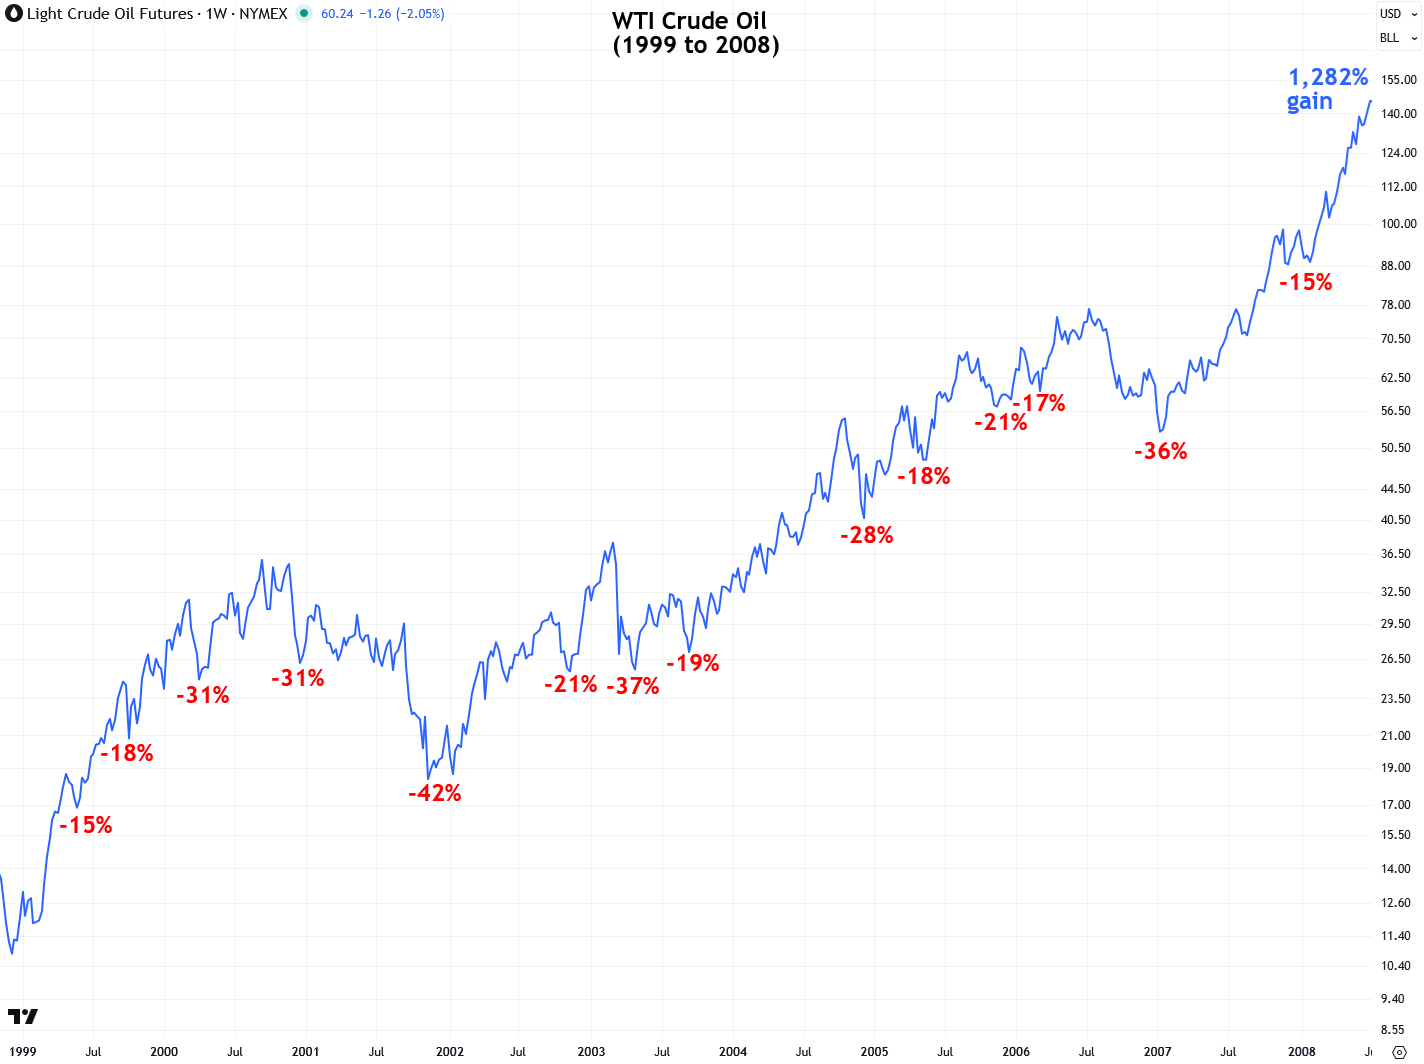
And lest you think pullbacks during bull markets are exclusive to precious metals, think again. This pattern occurs across ALL asset classes. For example, during crude oil’s massive 1,282% bull run from 1999 to 2008, there were at least fourteen pullbacks of 10% or more.
So far, we’ve only looked at commodities, so it would be understandable to think that pullbacks are limited to that asset class. But that is not the case. Consider the bellwether U.S. stock index, the S&P 500. Since the current bull market began in the depths of the Global Financial Crisis in 2009, the index has gained an incredible 930% and counting.